This page is prepared by Kayra Uzun and Hilal Gümüşlü as a part of ECON 318 requirements at Bilkent University for the Fall 2018-2019 semester. The purpose of this page is to assess the possibility of an oil pipeline between Iran & Russia to evade economic sanctions imposed on Iran. The evidence gathered here is valid by 23.XII.2018.
Summary
Iran is one of the most important crude oil producer. After the US sanctions Iran and Russia may decrease the effect of sanctions by establishing a pipeline between Iranian Caspian port Neka and Russian Caspian port Makhachkala and from Makhachkala to Russian Black Sea port Novorossiysk. The proposed capacity of the pipeline to be built is 500,000 bpd. The Neka-Makhachkala-Novorossiysk pipeline has a length of 1810 km. The estimated cost of the proposed project is $2.71B. The crude that Iran may export is Iranian Light blend. Given that Russia starts importing Iranian oil, their trade balance indicate that, they might trade in local currencies. Russia may utilize Iranian Light to counteract the rising discontent in Europe regarding Urals blend. Moreover, as Iranian blends have comparatively higher proportion of mid-distillates, this pipeline can serve as a lucrative tool for both Iran and Russia in the midst of sanctions against Iran.
A major challenge on this issue is the legal status of the Caspian Sea. It treats the seabed as territorial zones. This means that the proposed pipeline between Iran and Russia has to go through the territory of another littoral Caspian state. The interest of Azerbaijan, Kazakhstan and Turkmenistan in such a project and agree with letting it built might be, their own plans to build an East-West pipeline towards Europe to increase their agency and independency. Feasibility of the pipeline project seems promising, as Caspian’s depth is relatively low, and necessary pipeline laying ships can be brought to Caspian Sea from Black Sea.
Alternatively, maritime shipment between Neka and Makhachkala seems less feasible. Maritime shipment appears to be not feasible in terms of number of tankers required. The transportation cost of 500,000 bpd is approximately $0.77B per year. In about just 3.5 years, the shipping becomes more expensive than the pipeline project. Although, shipment deals can be altered really easily, making this option more versatile, in case US sanctions are lifted in the future, or Iran-Russia relationship deteriorates, it is not feasible either in terms of Russian and Iranian fleet size in Caspian Sea, or economic outlook. On the other hand, a pipeline can act as leverage for both Iran and Russia in its future international dealings, and it might be a better investment, when the long-term opportunities, and the long-term economic efficiency of pipelines are considered.
Caspian Sea Project
The Caspian Sea is surrounded by five countries which are called the “Caspian States” which are; Azerbaijan, Iran, Kazakhstan, Russia and Turkmenistan. The location of the Caspian waters holds a strategic importance in international geopolitics. Neither the international marine laws nor the laws of inland lakes apply directly to the Caspian waters.
Immense offshore hydrocarbon resources in the Caspian waters combined with its strategic location has made it into a top priority for the littoral states. Its strategic importance has increased the pressure to find a legal solution with which the coastal counties can all agree.
On August 12th, 2018, the 5th convention of legal status of the Caspian Sea, so called “Caspian Agreement” was signed. However, this does not mean the Caspian Agreement has resolved all the problems. The outline of legal status of the Caspian is given in general terms, the details are left behind.
If Caspian waters are considered as a lake, it is divided equally among five states (see Table 1). If it is considered as a sea, the maritime borders are determined based on its coastline. Iran has one of the shortest coastlines, thus supports the Caspian being a lake, mainly over its security concerns. Russia wants to access the whole lake for militaristic purposes, so Russia does not support neither shared lake nor shared sea view. Rather, Russia would prefer Caspian waters to be considered as international waters on the surface, so that it can have access to every point. For Turkmenistan and Azerbaijan, having greater access to gas and oil reserves is the main concern. However, with the convention signed on August 12th, 2018, the waters are treated as international waters meaning, the water surface above can be accessed by any country. This also creates an ambiguity; international water treatment of the surface water does not fit the conditions of shared sea nor shared lake. Seabed on the other hand will be treated as territorial zones, determined by other treaties, meaning, again, it is neither a shared sea nor a lake. Thus, convention doesn’t state Caspian as sea or lake. But, due to international water treatment, Caspian will be named more suitably as Caspian Sea.
41% of total crude oil reserves of countries in the Caspian region are located within the Caspian Sea. The total reserves of 48 billion barrels (bbl.) in Caspian region (onshore, offshore reserves combined) constitute 15.9% of total proven oil reserves in the five countries. The oil production in Caspian Sea compared to total production in neighboring countries corresponds to 9.83%.
For natural gas, 36% of natural gas reserves of the Caspian countries are located in offshore fields in Caspian Sea. This corresponds to 292 trillion cubic feet (Tcf) of proved natural gas reserves.
Iran’s oil production from the Caspian Sea is negligible. Same is true for Russia. On the other hand, majority of Azerbaijan and Kazakhstan oil production originates from the Caspian Sea. Also, Turkmenistan does not have the infrastructure for exploiting its oil or gas reserves.
The convention on the legal status of Caspian Sea makes is theoretically possible for countries to lay pipelines. The caveat is the convention does not clarify how the seabed will be shared among countries. However, all the countries have something to gain by resolving the disputes.
Turkmenistan with the help of the proposed Trans-Caspian Pipeline (TCP) to Azerbaijan can pick up its slowing economy, end its dependence on China, widen its customer range and find European partners that are more likely to invest in its vast natural gas reserves.
Kazakhstan might utilize an oil pipeline towards Baku-Tiflis-Ceyhan (BTC) to boost its trade volume, decrease its absolute dependency on Russia and China for energy transportation, increase the profit it makes from its oil trade and gives leverage as an alternative in its trade deals with other parties.
Azerbaijan may turn into an energy hub that feeds oil and gas to Europe, Turkey, and the Mediterranean by providing Turkmenistan gas and Kazakhstan oil. This advances its geopolitical importance, giving leverage in its deals with Russia, Iran, Europe and other third parties.
Iran may use a potential pipeline to Russia to evade the US sanctions. This way, it can decrease its dependency in US dollar and SWIFT system by dealing with Russia in local currencies and pick up its slowing economy and decreasing export revenues.
Russia by “allowing” an East-West energy corridor in the Caspian Sea can cause Kazakhstan and Turkmenistan to gravitate back towards Russian sphere of influence away from China. Moreover, economically stronger Turkmenistan might stand stronger against any potential Islamist extremist spillage from Afghanistan, securing Russian border. Also, helping Iran to evade the US sanctions by transporting its oil gives additional revenue and leverage against Russia’s negotiations with the US and decreases the US dollar trade that Russia conducts.
There is a possibility of a deal, that can allow fourth largest oil producer (Iran), to continue supplying oil to world, with the help of Russia and its Black Sea port Novorossiysk. Analysis shows that, both Iran and Russia have the pipeline infrastructure that has connections to a Caspian port city. Two countries can trade oil via ships, or a potential pipeline to be constructed between these two port cities. More importantly, Russia can start importing Iranian oil, which would actually close the trade imbalance between the countries, allowing them to trade in local currencies. However, preliminary analysis shows that, shipping oil from Iran seems much more plausible (click links for details) than constructing a pipeline between two countries.
Iranian oils can be classified as sour light/medium oils. The light, sour Iranian oils are Iranian Light, Lavan and Sirri. It doesn’t have any sweet crude oil types that are (ultra) light as well. Comparing the blends that Iran exports, there are several alternatives to it that are mainly produced in Middle East states or littoral Caspian states. Although this might imply competition, it also means, if one of its alternative’s quality is deteriorating, Iranian blends can be used to keep its quality. This case applies for Russia’s Ural Blends, as the quality of the Ural Blend that is being exported to Europe has been deteriorating in the recent years.
Therefore, this opens up the possibility of a potential trade deal between Russia and Iran. If Russia decides to import the Iranian oil, they might do it in local currencies to avoid U.S. sanctions. Russia can use the Iranian oil imports to improve the quality of Urals blend, or it can direct the oil to China by mixing it with ESPO blend. However, in both cases, the only desirable Iranian blend is Iranian Light, which is the 2nd most produced Iranian oil blend.
To transport the Iranian oil, a potential pipeline between Iran’s Caspian Sea port city Neka and Russia’s Caspian Sea port city Makhachkala can be built. The estimated project cost for such pipeline is estimated around $2.71B, with a capacity of 500,000 bpd and length 1810 km.
Legal Status of the Caspian Sea and Interests of Neighboring Countries
“Caspian Sea’s location at the crossroads of Asia, Europe, and the Middle East has kept the region’s strategic importance to international geopolitics.” (Karbuz, 2016).
“The
controversy over the legal regime of the Caspian Sea began with the
breakup of the Soviet Union in 1991. Until then, the Caspian had been
considered a common sea between Iran and the Soviet Empire. However,
following the collapse of the Soviet Union, the number of littoral
states increased from two to five, which in turn dramatically altered
the geopolitical dynamic. The birth of the new nation-states along
the perimeter of the Caspian Sea transformed the region into an area
of conflict, and its legal regime has become one of the contentious
disputes among the bordering countries. The existence of immense
offshore hydrocarbon resources in the Caspian Sea along with its
strategic location on a geopolitically significant transport route
have made it into a top priority in the foreign and domestic policies
of the littoral states. Its strategic importance has moreover
increased the pressure to find a legal solution on which the coastal
countries can agree; currently they hold different views on the
delimitation of the sea (surface waters).” (Abilov, 2013).
“Can the disputes over the legal status and regime of the Caspian Sea be resolved by the international laws?” Since the name of the Caspian is still not legally set as sea or lake, no international law is applicable (Karbuz, 2016).
International law does not bring a solution because the Caspian Sea which is a closed pond with no direct connection to the oceans, is either a sea or a lake, does not fully comply with the existing definitions of international law. This distinction is extremely important because of the different ways of sharing a lake or a sea. In the definition of “sea”, sharing rights are based on the United Nations Maritime Law. In the definition of “lake”, the sharing rights are allocated to the riparian states in equal sectors. In the middle of it all, there are different parameters from a puddle: Sea floor, subsoil, water layer, water surface and airspace.
First of all, when we examine in terms of oil and gas resources, sharing the seabed among these five countries seems like an important point and in terms of pipelines, sharing the sea floor is another important one. When we analyze from a military point of view, there are several issues to negotiate such as the water body, the water surface, and the airspace. In this region, fishery is a part of the issues of sharing the water body and the water surface. In order to solve the Caspian problem, senior officials of the foreign ministries of the riparian country met 52 times, foreign ministers met six times and held four summits at heads of the state level. Finally, on August 12th 2018, the fifth summit in Kazakhstan was finalized with signing of a 24-item agreement. The agreement will come into force after adoption in the councils of the riparian countries. However, this does not mean the Caspian Agreement has solved the problems. The issue of sharing in the Caspian is given in general terms, the details are left behind. The reference points that will form the basis of the determination of the borders are left to the mutual negotiations between the parties.
The agreement does not make it clear whether the legal status of the Caspian is a sea or a lake. However, the agreement accepts Caspian as a lake on some issues and accepts as a sea on some other issues. On the basis of international law, Azerbaijan, Iran and Turkmenistan are expected to reach an agreement to share the seabed by bilateral and tripartite talks. Iran, meanwhile, says it will not utilize any of its energy sources in the region, where reference points and sectors have been set up. Also, it is noteworthy that most of the 24 articles in the agreement are on military and security cooperation:
1) The riparian countries will not interfere in each other's internal affairs.
2) A non-coastal country will not have a military presence in the Caspian Sea and will not be able to take any military action against another Caspian country over a Caspian country. These decisions to keep the US and NATO away from the region seem to be a very important achievement for Russia and Iran. From this perspective, the agreement has significant gains for Russia and Iran. Another potential would be the Caspian Economic Forum, which Russia is attempting to establish, as well as a new North-South transportation and logistics corridor to be built, and Russia's fall into the hot seas, and the role that Iran will play in this (Karbuz, 2018)
Treating Caspian as a lake requires states to divide lake evenly, 20% to each. If it is treated as a sea, the division is done based on coastline length and maritime borders (Carroll, 2018; Indeo, 2018).
Table 1 - Distribution of Caspian Sea based on different statuses
|
Countries |
Coastline Length |
Proportion of Coastline (Law of shared sea) |
Share of Caspian Lake (Law of shared lake) |
|
Azerbaijan |
955 km |
16.2% |
20% |
|
Kazakhstan |
2320 km |
39.4% |
20% |
|
Iran |
724 km |
12.3% |
20% |
|
Russia |
695 km |
11.8% |
20% |
|
Turkmenistan |
1200 km |
20.4% |
20% |
Sources: Carroll, 2018; Azerbaijan.az, 2018
Table 1 suggests that Iran is the biggest supporter of establishing Caspian Sea as a lake. Also, Russia’s majority of energy production comes from other areas and thus, its main concern in Caspian region is not the amount of area it has, but rather militaristic control over it and singlehandedly controlling the energy flow to Europe. However, Russia’s main interest in Caspian region is not the north sections, but rather the southern areas. The reason is, the Russian navy can conduct operations in Syria if they are positioned in the South. Thus, having military access to South allows Russia to exert influence over Middle East, an area where its interest clash with the US. On the other hand, Iran wants to control waters that are close to its borders, meaning the southern section for security and sovereignty concerns. If Iran has the control of the southern section militarily, it can use it as leverage against other countries, especially Russia.
Due to lack of rigid laws and rules on Caspian Sea bonded by agreements, many areas were disputed, over territorial claims. All five states had to agree to execute a pipeline proposal which blocked many deals in the previous years (Karbuz, 2016; Carroll, 2018; Kramer, 2018).
The 5th Convention on Legal Status of Caspian Sea takes bits from both treating it as a lake and sea. Surface is treated as international water, meaning no one can have claim of sovereignty on the water. This mainly interests Russia and Iran, especially Russia. This is because, Russia wants military access to Middle East, over its political and diplomatic goals. South Caspian Sea actually is close enough to Syria to allow Russia to perform military actions with it ships from there. However, South Caspian Sea is really far away from Russian soil. Thus, the only case in which Russia accesses this region is by declaring the surface of Caspian Sea international waters. Seabed on the other hand is divided into territorial zones. This convention leaves the agreement on a pipeline project to those countries which have the pipeline on their territory, although other states can challenge this on environmental concerns. However, Russia finally agreeing on such a convention is interpreted to have relation to the Belt and Road Initiative (BRI) of China. Kazakhstan and Turkmenistan both have directed their pipelines towards China or Eastbound in general due to impasse at East-West pipeline in Caspian Sea caused by Russian objections. Russia does not want to lose its influence over CIS countries to China, so it might be more lenient towards East-West pipelines for the sake of decreasing Chinese influence in these countries (Kramer, 2018).
In case Caspian waters are accepted as a sea, the UN Convention on the Law of the Sea UNCLOS would apply, but states other than Russia did not even ratify it (Karbuz, 2016). In short, the agreement on August 12th, 2018 does not state the Caspian as a lake or sea firmly. On the surface, it is treated as international water, on the seabed, it is divided into territorial zones, resembling more of lake-like approach (Indeo, 2018).
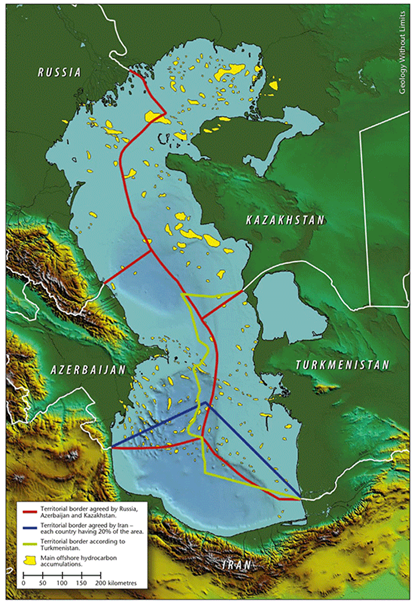
Figure 1 - Division of Caspian Sea based on arguments of five states
Source: Petrov & Amelin, 2015
Figure 1 shows about the various divisions of five Caspian countries. Blue lines denote Iran’s desire, yellow denotes Turkmenistan’s and red is the territorial borders agreed by Azerbaijan, Kazakhstan and Russia. Especially Iran and Turkmenistan have their own claims over the region. Considering it as a lake especially aggravates the disputes, as equal division divides the sea region extremely different from division by coastline (which is seen as a fairer distribution by many countries in the region) (Karbuz, 2016).
Oil and Natural Gas Outlook in Caspian Region
Figure 2 - Oil and Gas Reserves in Caspian and Middle East Region
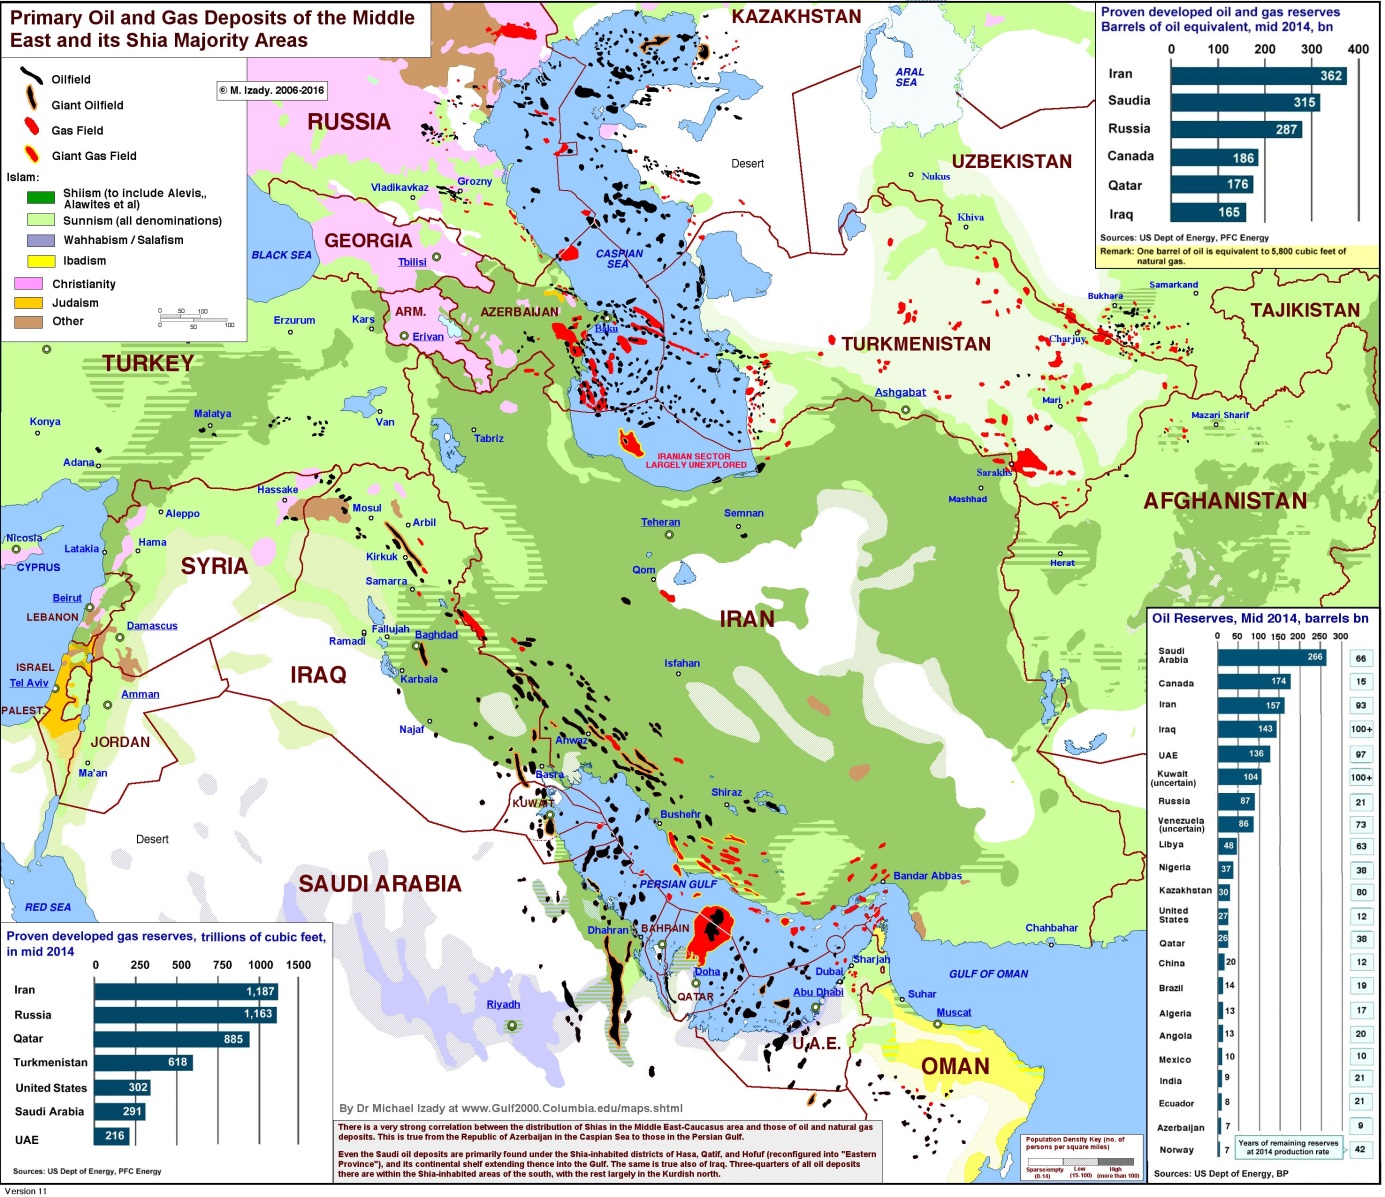
Source: Shwarz, 2016
Figure 2 shows the oil and gas reserves in the Caspian Region clearly. As seen, the reserves in Caspian Sea are immense, even comparable to Middle East Region, but unexploited until this time due to disputes. Kazakhstan and Turkmenistan have large offshore oil reserves, and Azerbaijan have large offshore natural gas reserves.
Crude oil specifications change from geographic location to another. However, there are main properties that distinguish the quality of oil from another. These are, API Gravity, sulfur content and viscosity. API Gravity is a measurement that is closely related to the compounds density. If the API of oil is below 20, it is classified as heavy oil. If it is higher, it is light oil. Sulfur in crude oil doesn’t yield high value end products when refined and is classified as contaminant. Moreover, it is a major contributor to air pollution, and it is corrosive. Therefore, refineries and pipelines that carry/process oils with higher sulfur content require much more frequent maintenance, and even some of them might be unable to process high sulfur content oils for this reason (Petroleum.co.uk, 2018). If the percentage of sulfur in a crude oil is below 1%, it is sweet oil. If not, it is sour oil. Viscosity determines how much a fluid resists flowing. Thus, if it has high viscosity and resists flowing, it makes things much harder in pipelines or refineries, making transportation more difficult (Petroleum.co.uk, 2018). In refineries, crude oil is distilled to produce variety of products. Products in upper rows in Figure 3 have lower boiling point, lower density and are more valued (Sunshine, 2018). This means that, if the crude oil that is refined has high density (low API), yields more of the heavier products as seen in Figure 3. In order to obtain high valued lighter products, the heavy crude oil needs to be processed much more with sophisticated techniques (U.S. Energy Information Administration, 2018). Also, most of the time sulfur as a contaminant has to be removed, which needs again, sophisticated techniques (Petroleum, 2018). In addition, high viscosity oils need to be put through dilution process to be carried by pipelines and refineries. Thus, the energy returned on energy invested (EROEI) ratio of sour and heavy oils is lower than EROEI of sweet and light oils (Petroleum.co.uk, 2018).
Figure 3 - Crude Oil Distillation
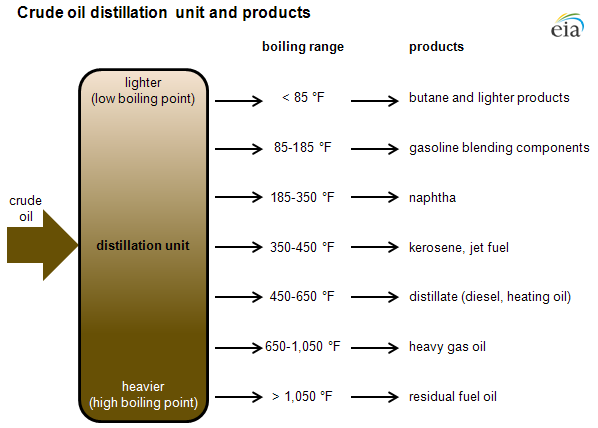
Source: EIA, 2018
Thus, the main objective of blending oils is to optimize these parameters for the specific purpose. For example, the reason might be to meet sulphur limits of pipelines, environmental laws. It might be to be able to market poor quality un-transportable crude by optimizing viscosity (Cameron, 2012). It might be to meet benchmarks and certain price points. This means that sweet light oil is always preferred, but since they make up only 30% of world’s reserves, they are generally used together with sour heavy oils(Petroleum.co.uk, 2018). In addition, the cost decrease between heavy and light blends sometimes offset the cost of producing light blends.
Currently, there are various techniques for mixing oils. However, the idea of it is relatively simple. The properties of a blend are determined by the weighted average of the properties of the initial oils with respect to their mass ratio in the blend (Cameron, 2018). For example with 50 – 50 mass ratio of Iranian Heavy and Iranian Light, we get,
Table 2 - Result of Blending Iranian Heavy and Iranian Light
|
Important Oil Metrics |
Iranian Heavy |
Iranian Light |
Formed Blend’s Properties |
|
% mass in Mixture |
50 |
50 |
- |
|
Density at 15°C (kg/m3) (Correlated with API) |
879 |
857 |
867.86 |
|
Sulphur (% mass) |
2.24 |
1.46 |
1.85 |
|
Viscosity at 10°C (cSt) |
30.53 |
19.50 |
24.24 |
Source: Cameron, 2018
In short, when a blend is created, it is done by mixing high quality crude oil with low quality oil. The exact properties of the end result are determined by changing the ratio of the mixed oils. Moreover, Table 2 indicates that when forming blends, the most important metrics are API gravity (which is related to density), sulphur content and viscosity.
41% of total crude oil reserves of countries in Caspian region come from offshore fields in the Caspian Sea (U.S. Energy Information Administration, 2013).
Compared to total reserves in countries neighboring the Caspian Sea, (Azerbaijan, Iran, Kazakhstan, Russia, Turkmenistan), the total reserves of 48 billion barrels constitute 15.9% of total proven oil reserves in the five countries (U.S. Energy Information Administration, 2013; BP, 2018).
The oil production in Caspian Sea compared to total production in neighboring countries corresponds to 9.83% (Azerbaijan and Turkmenistan statistics are from 2013 report of EIA, as they are the most recent available data. Iran, Russian Kazakhstan statistics are from 2017.) (U.S. Energy Information Administration, 2013, 2018; OPEC, 2018).
Table 3 - The share of crude oil production in Caspian Region 2012/2017
|
Countries |
Crude Oil Production in Caspian (mb/d) |
Crude Oil Production (mb/d) |
Share |
|
Azerbaijan |
882 |
882 |
100% |
|
Iran |
Negligible |
3867 |
~0% |
|
Kazakhstan |
502 |
1467 |
30.17% |
|
Russia |
41 |
10349 |
0.38% |
|
Turkmenistan |
225 |
225 |
100% |
|
Total |
1650 |
16790 |
9.83% |
Sources: EIA, 2013, 2018; OPEC, 2018
Notable observations are, Iran’s oil production from Caspian Sea is negligible. Same is true for Russia. On the other hand, majority of Azerbaijan and Kazakhstan oil production originates from the Caspian Sea. Also, Turkmenistan does not have the infrastructure for exploiting its oil reserves at all. The only international oil pipeline Turkmenistan has is between Seidi refinery in Turkmenistan and Shymkent refinery in Kazakhstan via Uzbekistan (U.S. Energy Information Administration, 2018).
Table 4 – The share of oil and gas exports of Caspian countries 2016 (USD)
|
Countries |
Total Crude Oil Exports |
Total Gas Exports |
Total Exports |
Share of oil |
Share of gas |
|
Azerbaijan |
$9.35B |
$1.09B |
$12.3B |
76.3% |
8.9% |
|
Iran |
$25.7B |
$104M |
$40.6B |
63% |
0.27% |
|
Kazakhstan |
$13.2B |
$1.35B |
$32.8B |
40% |
4.12% |
|
Russia |
$75.7B |
$11.3B |
$269B |
28% |
4.2% |
|
Turkmenistan |
$484M |
$5.26B |
$7.06B |
6.9% |
74.5% |
Source: The Observatory of Economic Complexity, 2018
Table 5 - Total oil production and export quantity of Caspian countries 2017 in mb/d
|
Countries |
Crude Oil Exports (mb/d) |
Crude Oil Production (mb/d) |
Share |
|
Azerbaijan |
615.3 |
729 |
84.4% |
|
Iran |
2125 |
3867 |
54.95% |
|
Kazakhstan |
1371 |
1467 |
93.45% |
|
Russia |
5062 |
10349 |
48.9% |
|
Turkmenistan |
38.7 |
181 |
21.38% |
Source: OPEC, 2018; Federal Reserve Bank of St. Louis, 2018
For natural gas, 36% of natural gas reserves of the Caspian countries are located in offshore fields in Caspian Sea. This corresponds to 292 trillion cubic feet (Tcf) of proved natural gas reserves. Surveys indicate that there is another 243 Tcf of natural gas yet undiscovered.
Iranian Oil Metrics and Blends
Table 6 depicts the metrics of Iranian oil with respect to National Iranion Oil Company (NIOC) values. For reference, Brent, the international benchmark for oil, reached around $70 on Jan 9th, 2018 for reference (Financial Tribune, 2018).
Table 6 - Iranian Oil Grades and Types
|
Type of Oil |
Typical API Gravity |
Typical Sulphur (%) |
Share of Production (%) |
Inferred Export Quantity (bpd) |
Price (peak on Jan, 9th, 2018) |
|
Forozan |
30.4 |
2.21 |
- |
160 |
- |
|
Iranian Heavy |
29.6 |
2.24 |
45 |
1250 |
$64.11 |
|
Iranian Light |
33.6 |
1.46 |
35 |
450 |
$66.01 |
|
Koroosh |
20.0 |
3.08 |
- |
- |
- |
|
Lavan |
35.4 |
1.67 |
2.97 |
140 |
- |
|
Pars |
22.4 |
4.25 |
- |
- |
- |
|
Sirri |
33.0 |
1.83 |
- |
80 |
- |
|
Sooroosh |
18.9 |
3.88 |
- |
90 |
- |
Source: Financial Tribune, 2018; EIA, 2015; NIOC, 2018
Iranian Heavy is classified as medium (crude oil that has API between 22.3 and 31.1), sour (crude oil that has more than 1% sulphur) crude oil and is sourced from some of Iran’s largest oil fields, named Gachasaran, Marun, Ahwaz and Bangestan (Petroleum.co.uk, 2018; Brittanica, 2018).
Iranian Light, a light (crude oil that has API higher than 31.1), sour on the other hand comes from several fields that are decades old and have large decline rates, such as Ahwaz, Karanj and Aghajari (Petroleum.co.uk, 2018; EIA, 2018). Sustaining the production in these fields long term require Enhanced Oil Recovery techniques that are quite costly (EIA, 2018; Rigzone.com, 2018). In other words, production of Iranian Oil is projected to either decrease, or to become costlier. The exact reserve/quantity of a blend is not really defined, as it comes from different fields. Therefore, the only statement that can be made is, the fields that Iranian Light comes from have declining reserves and production rates in a rapid pace.
Iranian Oil Blends and Their Usage
As stated in section 2.1, the mixing is done by mixing a quality improver (sweet and light oil) with a quality degrader (sour and heavy oil) and the end products properties are determined by ratio of the mixed oils. This means that, there are no inherent limitations to usage of Iranian oil, other than whether it will be used as quality improver or degrader. Iranian blends are, Foroozan Blend, Iranian Heavy Blend, Iranian Light Blend, Lavan Blend and Sirri Blend as given in table 6 (U.S. Energy Information Administration, 2018). However, as Iran exports its oil via shipping, there is no lower limit (low API, high viscosity limit) to the viscosity or API compared to how it otherwise would have been with pipelines. There is an upper limit, but as Iranian oils are not ultra-light, this does not appear to be an issue. Thus, the importers of Iranian oil process and blend the oil with an oil of their choice in the refineries of their own country, if it is necessary (U.S. Energy Information Administration, 2018). This means that the commercially sold Iranian blends are those which are formed by Iran. However, oil of Iranian origin can get blended with other oils, but this is done domestically by importers, of which there is not a given name.
If one still asks which blends Iranian oil might be part of, one has to look for export destinations of Iranian crude oil. Figure 4 shows the countries that have higher chance of using Iranian oil in their domestic blends.
Figure 4 - Iran Crude Oil Exports by destination
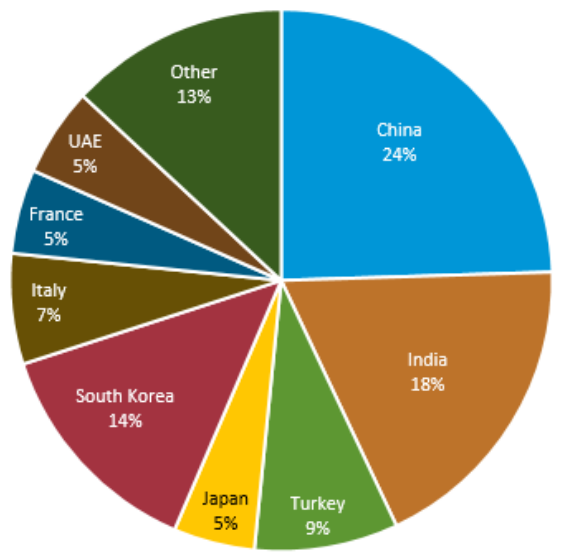
Source: EIA, 2018
Moreover, as Iranian Light is not ultra light, it contains relatively higher proportion of mid distillates compared to other light crudes from around the globe. Current estimations project that, mid-distillate products such as jet fuel and diesel demands will increase in the upcoming years (Bloomberg, 2018). The mid-distillates have lower proportion in lighter crudes. Therefore, this seems promising for the future value of Iranian crudes.
Table 7 - Russian Oil Blends' Metrics
|
Type of Oil Blends |
Typical API Gravity |
Typical Sulphur (%) |
Destination |
|
Urals |
31 |
1,4 |
Europe |
|
Sokol |
35.5 |
0,28 |
India |
|
Sakhalin |
37.3 |
0,16 |
Japan, India |
|
ESPO |
34.8 |
0,47 |
China |
|
Varandey |
37.8 |
0,42 |
- |
|
ARCO |
24 |
2,3 |
Europe |
|
Novy Port |
30-35 |
0,1 |
Europe |
Source: Financial Tribune, 2018; EIA, 2017; NIOC, 2018
Figure 5 - Russian Oil Extraction Zones
Source: EIA, 2014
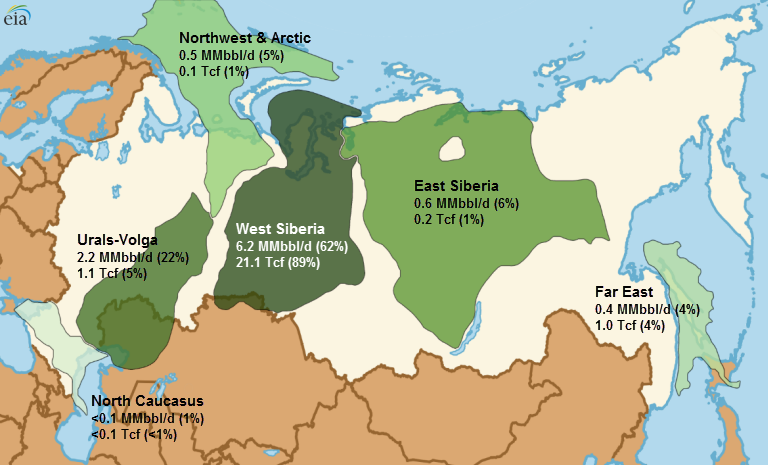
Urals Blend given in Table 7 is the main export blend of Russia. It is used to supply oil to China and Europe. As indicated in table 7, Urals blend is medium gravity (around API of 31), sour (around 1.4% sulfur content). It is therefore, a mixture of lighter and sweeter crude oil and heavier and sourer crude oil. The sweet and light crude oil in the Urals Blend comes from West-Siberia region. The sour and heavy crude oil in the Urals Blend comes from Urals-Volga region. As indicated in Figure 5, 62% of crude oil production originates in West-Siberia region and 22% originates in Urals-Volga region. These highly produced crude oils coming from 2 different regions are blended to form the main export blend, Urals Blend in high quantities (Metelitsa & Albanese, 2014).
Both Urals-Volga and West-Siberia regions cover a significant amount of geographical area. Thus, within these regions, the quality of oil is not extremely clear cut, it varies. Moreover, since the oil extracted from these regions is not exported directly, their API Gravity values and sulfur content values are not available. Instead, the blend that is formed is exported, and thus blend’s API Gravity and sulfur content values are known. However, a rough estimate can be made on the quality of oil extracted from Urals-Volga and West Siberia region. Crude oil extracted from Urals-Volga is heavy and sour. This puts crude from Urals-Volga region at API Gravity less than 25 and sulfur content higher than 1.8% (Ricker, Barron & Hamilton, 2017; Soldatkin, 2018). The crude extracted from West Siberia region is then put at API Gravity higher than 35 and sulfur content less than 1% (Metelitsa & Albanese, 2014; U.S. Energy Information Administration, 2017).
ESPO Pipeline Details
Eastern Siberia Pacific Ocean (ESPO) oil pipeline exports crude oil from Russia to the Asian Pacific markets of China, Japan and Korea. This oil pipeline is a 4,188 km-long system.
The first ESPO pipeline branch starts flow from Mohe at Russian border to the Chinese city of Daqing. Since 2011, Russia sent 15 million tons a year of its crude oil to China. The second oil pipeline was built in parallel with the first line between Mohe and Daqing (Verma, 2018). From 1st January, 2018, this second line increased Russia crude oil export capacity from 15 million tons to 30 million tons (600kbd) annually according to Xinhua reports (Verma, 2018).
Turkmenistan has the 4th largest natural gas reserves in the world but it ranks 11th in terms of natural gas production, as it greatly lacks the infrastructure needed for production and exporting (BP, 2018). For this reason, it relied heavily on its neighbor countries, Russia, Iran in early 2010s for income. For perspective, 62.7% of Turkmenistan’s gas export’s destination was Russia in 2008, with a quantity of 35 billion cubic meters (bcm). This fell to 10 bcm by 2015, corresponding to 24.81% of Turkmenistan’s gas exports. Similarly, Turkmenistan had a deal of 6-8 bcm/year with Iran that continued for years, corresponding roughly to 13.3 – 26.75% of Turkmenistan’s gas exports. Both Russia and Iran stopped importing gas from Turkmenistan in 2015 and 2017 respectively, bumping China’s share as the gas export destination from around 65% to 80% (OPEC, 2018). The Central Asia-China Pipeline (CACP) has been the main pathway for the exports from Turkmenistan to China (BP, 2018; U.S. Energy Information Administration, 2018; Pirani, 2018). Moreover, China started to use the loan it gave to Turkmenistan for developing gas fields in Galkynysh to lower the price of the imported gas (Pirani, 2018). With Iran and Russia gone, and Turkmenistan only option, China playing “not so cleanly”, Turkmenistan’s economy started to deteriorate as seen in Table 8 (Pirani, 2018). Furthermore, Russia’s Power of Siberia pipeline will start supplying gas to China by early 2020 (AzerNews, 2018). Also, China has been investing in LNG handling facilities and upping its imports from Qatar, the US and Australia (AzerNews, 2018). In the future, when increased competition awaits Turkmenistan, diversifying its own options is a great strategy. As Russia and Iran were blocking any possible pipeline from the Caspian Sea for decades, Turkmenistan came up with Turkmenistan-Afghan-Pakistan-India (TAPI) pipeline, but it is plagued by dealings with Taliban and Turkmenistan bearing 85% of the project’s total cost with a very small economy (Pirani, 2018). This means that Trans-Caspian Pipeline (TCP) can be the viable solution for Turkmenistan if the disputes are resolved. It has already built an East-West pipeline system in 2015, connecting its gas fields in East to the Caspian Sea (U.S. Energy Information Administration, 2018). Through Azerbaijan and TANAP, there is already an existing pathway for Turkmenistan gas as seen in Figure 6 (Pirani, 2018).
Figure 6 - Natural Gas Pipelines in Caspian Region excluding Iran
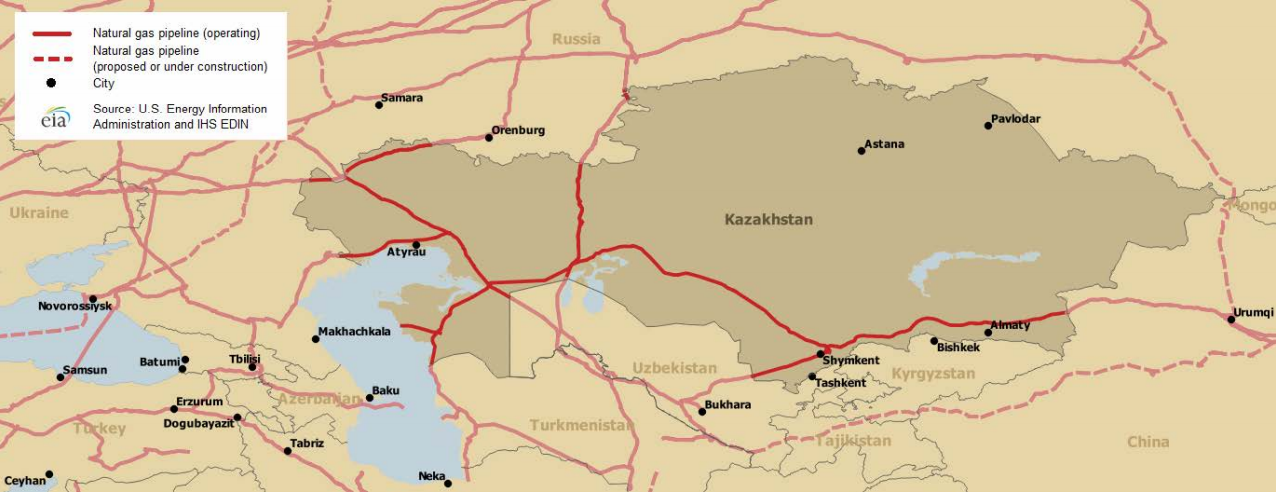
Source: U.S. Energy Information Administration, 2018
Europe and Turkey are possible customers, and both of them want to diversify their energy import portfolio, to decrease their dependence on Russia. Europe itself was pushing for Trans Caspian pipeline and a southern corridor since 1990s (Pirani, 2018). In 1990s, Turkmenistan’s discovered gas reserves were 2.6 trillion cubic meters (tcm). By 2017, this has increased to 19.6 tcm (BP, 2018). Knowing long term payoffs of a potential TCP is higher for the Europe, The EU adopted a mandate in 2011 to negotiate a legally binding treaty between European Union (EU), Azerbaijan and Turkmenistan (AzerNews, 2018). Moreover, the gas prices from Turkmenistan especially to Turkey and Southeast Europe are projected to be competitive against Russian prices (Pirani, 2018). Considering all these together, Turkmenistan can benefit greatly from resolving disputes and constructing TCP. With that, it can pick up its slowing economy, end its reliance on China, increase its customers, and find European partners that are more likely to invest in its vast natural gas reserves.
Table 8 - Turkmenistan's foreign trade, in US dollar billion
|
$ billion |
2010 |
2011 |
2012 |
2013 |
2014 |
2015 |
2016 |
2017 |
|
Exports |
9.7 |
16.8 |
20 |
18.9 |
19.8 |
12.2 |
7.2 |
7.8 |
|
Imports |
8.2 |
11.4 |
14.1 |
16.1 |
16.6 |
14.1 |
13.2 |
10.2 |
|
Balance |
1.5 |
5.4 |
5.8 |
2.8 |
3.1 |
-1.9 |
-6.0 |
-2.4 |
Source: Pirani, 2018
Kazakhstan’s major energy export is oil. Due to disputes over Caspian Sea, it connected its export routes to two countries, China and Russia. Main export routes for Kazakhstan oil are Caspian Pipeline Consortium (CPC) to Russia’s Novorossiysk, Kazakhstan-China pipeline, and the Uzen-Atyrau-Samara pipeline to Russia as seen in Figure 7 (U.S. Energy Information Administration, 2018).
Figure 7 - Oil pipelines in Caspian Region excluding Iran
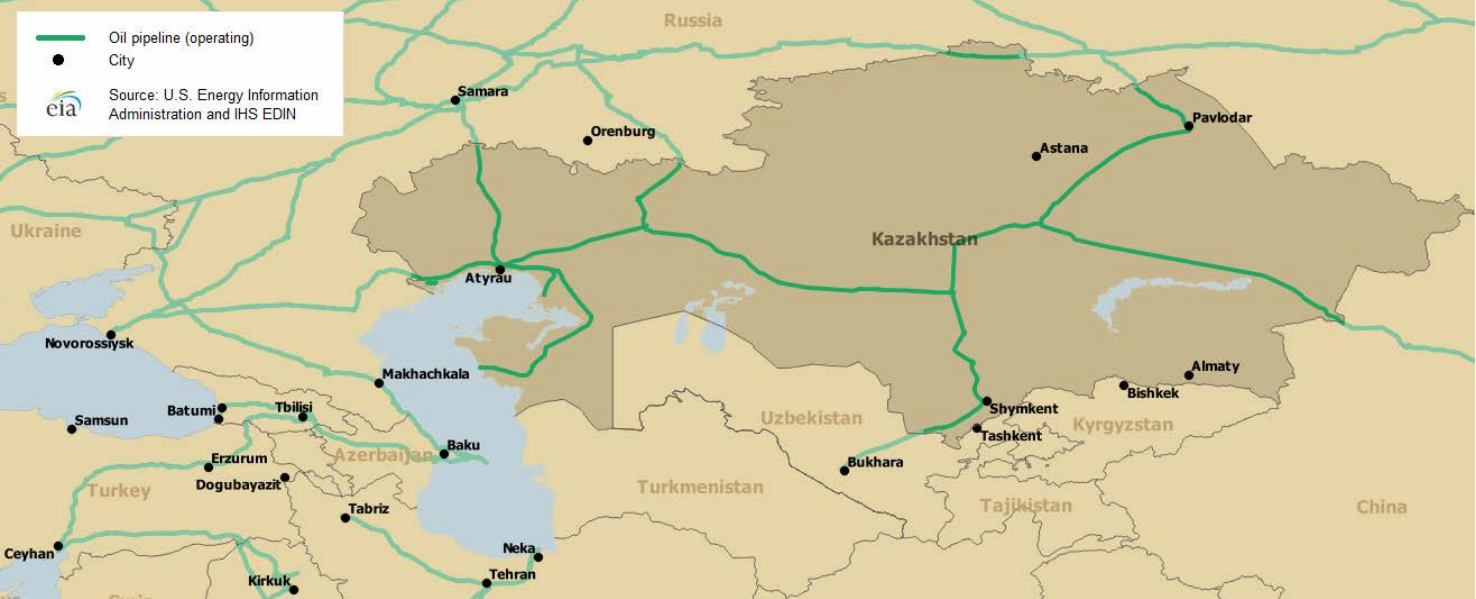
Source: U.S. Energy Information Administration, 2018
Similar to Turkmenistan, Kazakhstan depends greatly on pipeline deals with Russia and China. Utilizing a Trans Caspian Oil Pipeline to Azerbaijan then to BTC would greatly increase Kazakhstan’s option in many ways. For example, CPC was developed by Russia to compete against BTC. Therefore, diversifying towards Azerbaijan not only opens up increased trade volume from that route, but also gives leverage to Kazakhstan against Russia. BTC has capacity for Kazakhstan oil, as it operates at just two-thirds of capacity (Coleman, 2018). Moreover, BTC avoids the traffic in Bosporus and Black Sea and value reducing shipments through China or Russia (Coleman, 2018). In short, an oil pipeline to BTC potentially increases the trade volume of Kazakhstan, increases the profit it makes from oil trade, gives leverage against its existing trade partners and reduces trade risks by diversification.
Azerbaijan already supplies gas and oil from the Southern corridor (U.S. Energy Information Administration, 2018). However, the volume of it has left much to be desired (Pirani, 2018) (Coleman, 2018). If the disputes are resolved, Azerbaijan can become a key transit hub for oil and gas due to increased trade volume from Kazakhstan and Turkmenistan, both of which are projected to be major oil, gas suppliers respectively in the future (Aliyeva, 2018). This boosts its geopolitical importance immensely and gives it leverage in its dealings with Russia, Iran, Europe and others.
Iran is a major player in the energy market, ranking 4th in oil reserves and 2nd in gas reserves in the world (BP, 2018). However, due to political clashes with the US, Iran is having issues translating its existing infrastructure to profit (Beevor, 2018). After lifting the sanctions against Iran in 2015, the US is again threatening Iran with serious sanctions. The sanctions ban any transactions with Iran involving US dollar, gold or other precious metals (Harris & Ewing, 2018). Moreover, the US is trying to get SWIFT system to exclude Iran from using it. In 2012, SWIFT transactions from Iran were blocked. Compared to $92.5 billion revenues from oil exports in 2011, the revenue fell to $52 billion in 2012, after the sanctions (Beevor, 2018). The effects of the SWIFT ban are still reflected on Iran’s export revenue, which sits at $25.7 billion in 2016 as seen in
4. Moreover, the most recent sanction threats have already affected Iran’s exports as seen in Figure 8. While the crude oil exports of Iran were 3.8 mb/d in 2017, it has decreased to approximately 1.7 mb/d by September 2018 (Bloomberg, 2018).
Figure 8 - Iran crude oil exports (mmb/d)
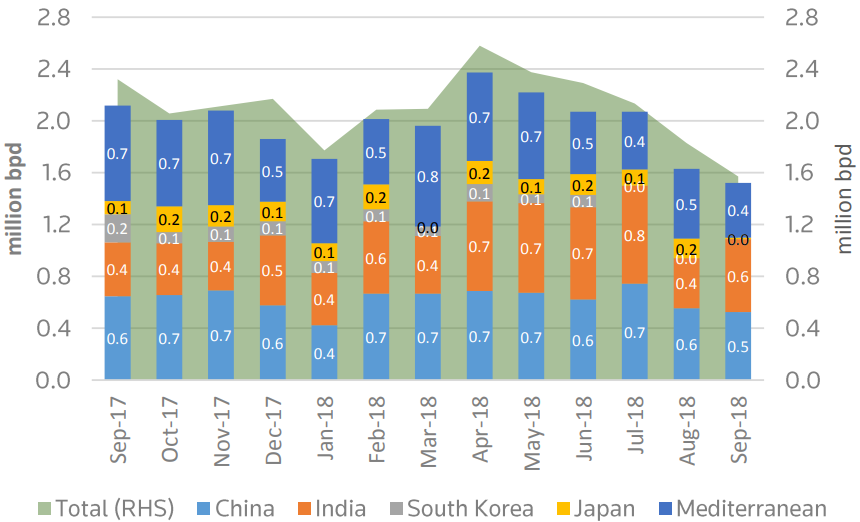
Source: Eikon, 2018
Major implication of resolution of Caspian disputes is that, Iran can use a potential pipeline project in Caspian to evade the sanctions. Iran is already doing so with China by dealing in local currencies, as their trades are relatively balanced with the help of Iran’s oil shipments as seen in Tables 12 and 13. However, by utilizing a pipeline to Russia, Russia can mix Iranian oil and distribute it to Europe, Turkey or other countries via Novorossiysk port. Russia is the most likely candidate, as they have outspokenly stated that they are heavily against the US sanctions (Beevor, 2018). Moreover, Russia even stated that, they are willing to purchase Iranian oil in exchange for increased purchases of Russian goods and services (Foy, 2018). The trade scheme shows that, if Russia decides to buy more oil from Iran, their trade can be balanced, making dealing with local currencies a possibility as seen in Tables 10 and 11 In short, Caspian poses a great potential for Iran to evade the US sanctions and as a backdoor for its oil and gas trade. With such a route, it can increase its export volume as well.
Russia has been trying its best to keep Kazakhstan and Turkmenistan out of the competition in European markets. However, it has realized that this might not be the best option for itself in the long run (Kramer, 2018). In response to the constant blockage coming from Russia, both Turkmenistan and Kazakhstan have gravitated towards Chinese sphere of influence. Politically, resolving disputes in Caspian Sea can bring Kazakhstan and Turkmenistan closer to Western scene away from China’s BRI, thus closer to Russia (Kramer, 2018). In addition, Russia is especially weary of possible terrorist spillage closer to its border. For this reason, if Turkmenistan and Kazakhstan are better off economically, a potential Islamist insurgency spilling over from Afghanistan can be prevented more easily (Pirani, 2018). Moreover, a potential pipeline with Iran can let Russia deal Iranian oil and collecting revenue from it. Also, by helping Iran evade the US sanctions, Russia gets a political leverage against the US in its diplomatic dealings. This might be especially beneficial for Russia, as it is currently negotiating with the US quite a lot over Middle East disputes (Crooks, 2018). In summary, by opening up the East-West corridor, it can bring CIS countries away from China, secure its borders against terrorism and by brokering a trade deal with Iran, it can gain economic benefits and diplomatic leverage against US.
Potential damages for Russia and Iran
From the Russian point of view, the Caspian Region has some apprehensions because of its high potential and strategic location. Other border countries may conflict with Russia’s interests.
Russia and Iran have always opposed the Trans-Caspian oil and gas line projects, although a lot of pipelines have been installed in the Caspian. Thus, they blocked the competition as much as possible. Russia is trying to keep the Caspian region under its control because Russia may face the risk of losing its own oil and gas market when the Caspian’s resources are reached by providing economic opportunities. Russia is using all its power in this region and is still trying to keep Caspian’s border countries under its control. Actually, the main reason of Russia is based on past events, when it was understood that the oil production of the Russian Federation began to decline after 1991, the proven oil reserves of 10 bbl in the Caspian Sea in the north triggered Russia's interest in marine resources at the expense of geopolitical concerns
“Generally, Russia’s initial inability to reconcile all its interests was largely due to the lack of consensus on foreign-policy priorities among Russian political elites, the inability of the government to oversee and coordinate policies pursued by different agencies, and the growing power of economic lobbies. Its desire to preserve the exclusive character of its influence, its “informal empire” in the Caspian region, opposed any external involvement into the region. Thus, the first decade for Russia brought no progress in negotiating a new legal regime and defining the status of the Caspian. Contributing factors were the internal turmoil within the country fueled by chaotic privatization, the lack in expertise in the Foreign Ministry, and the Caspian states’ eagerness to decrease their dependence on the federation. Additionally, the conflict in Chechnya hampered political and economic reforms and negatively affected the stability of Russia itself. By the end of Yeltsin’s term, Russia’s position in the Caspian was weak and full of contradictions. Even Iran deemed the federation as an important but unreliable ally” (Zimnitskaya & Geldern, 2010).
However, since Iran does not intend to compete with Russia in the European gas market, Iran is facing the potential markets in the East, namely Pakistan and India. Iran wants that Turkmen gas would go Pakistan or India through its own territory. Therefore, Iran does not want to the TAPI (Turkmenistan-Afghanistan-Pakistan-India) gas pipeline project supported by Russia to take place. Even if Russia confirms Iran’s request, it is unclear what the US’ position on Afghanistan will be. According to present situation of Afghanistan, this does not seem to be feasible plan.
Potential damages for Turkmenistan
In 2016, the flow of Turkmen gas to Russia stopped because of disagreements between Turkmenistan and Russia. A year later, Iran's gas flow was interrupted. That is, Turkmenistan's annual total of 50 billion cubic meters of natural gas trade stopped (Karbuz, 2018). Aside from its gas swap agreements with Iran, the only important customer left: China. In this case, Turkmenistan is warmly welcomed to take its gas to Europe. However, the latest agreement in 2018 includes an item which is article 15 states certain conditions: As stated in previous agreements and protocols, it will comply with environmental standards in international norms and will not harm the environment and ecological system (Convention on the Legal Status of the Caspian Sea, 2018). In other words, it is not possible to veto the pipelines, but it seems that they will be able to remove any difficulties on the grounds that they can create a potential risk for the Caspian Sea. In addition, it is also necessary to question how the attitude of Russia and Iran would be to the Turkmen gas going to Europe. Russia probably would not welcome Turkmen gas in the European market against itself without an ulterior motive. Russia may possibly buy Turkmen gas and re-export it.
Conclusion for damages
“Yet to allow ourselves one more final paradox, this situation has worked to the advantage of the small states, Azerbaijan and Kazakhstan, to the hindrance of the Russian Federation, and to the distinct disadvantage of Iran.
Azerbaijan, which initially insisted that the Caspian waters is a sea that must function under the UNCLOS, has profited by the Caspian’s uncertain status as a lake on its surface, and a sea beneath. Russia has achieved some of its goals, foremost control of the surface waters, through this status, and it is rushing to catch up to Azerbaijan in its capacity to exploit petroleum resources. Iran, which insists that the Caspian is a lake which must be divided according to terms of the Soviet–Iran Treaties, finds itself excluded from both the seabed resources and most of the surface by the legal vacuum created by its intransigence. Yet ultimately, until the Caspian is brought fully under the umbrella of the international rule of law, these outcomes will remain imperiled by changing circumstances. Azerbaijan has been able to tap into the rich oil fields that would be part of its EEZ under UNCLOS. It has done so under the protection of its bi-lateral treaties with Russia” (Zimnitskaya and Geldern, 2010, 12).
If the complex paradox formed in the Caspian can be solved, Russia and Iran seem to be the two countries that will suffer the most. If the return of plans of Kazakhstan oil to international markets via the Trans-Caspian oil pipeline project through the Baku-Ceyhan pipeline will again cause major problems for Russia and Iran.
Trade Statistics for Caspian Region
This section outlines the trade statistics for the Caspian Region.
Overall trade balance between Caspian countries
Table 9 - Trade balance between Caspian countries 2017 (US$ Million)
|
Partner Host |
Azerbaijan |
Iran |
Kazakhstan |
Russia |
Turkmenistan |
|
Azerbaijan |
- |
-221.37 |
-71.49 |
-884.4 |
-55.99 |
|
Iran |
296.88 |
- |
101.35 |
-418.77 |
405.19 |
|
Kazakhstan |
72.16 |
416.50 |
- |
-6,957.76 |
10.95 |
|
Russia |
952.81 |
924.16 |
7,324.58 |
- |
258.79 |
|
Turkmenistan |
55.99 |
-405.19 |
-10.95 |
-258.79 |
- |
Source: ITC, 2018
A notable takeaway from table 9 is that, Russia is running a trade surplus against all the Caspian countries. Thus, theoretically Russia has the financial space of increasing its imports from its neighboring countries. Actually, it might be motivated to do so, in order to balance out the trade. This in turn allows the nations to trade in local currencies, if none of the trading partners are bleeding out foreign currency constantly.
Although Azerbaijan’s trade with Kazakhstan and Turkmenistan is relatively balanced, it is still negative. Thus, if Azerbaijan starts importing Turkmenistan gas or Kazakhstan oil from a hypothetical pipeline in Caspian Sea, its trade deficit would increase. This might be potentially undesirable for Azerbaijani economic and political goals.
Table 10 - Russia's exports to Iran by product 2016
|
Host |
Partner |
Product Group |
Export (US$ Million) |
Export Product Share (%) |
|
Russia |
Iran |
All Products |
1,882.8 |
100 |
|
Russia |
Iran |
Capital goods |
652 |
34.65 |
|
Russia |
Iran |
Consumer goods |
46 |
2.42 |
|
Russia |
Iran |
Intermediate goods |
536.2 |
28.49 |
|
Russia |
Iran |
Raw materials |
331.3 |
17.61 |
|
Russia |
Iran |
Animal |
0.067 |
0 |
|
Russia |
Iran |
Chemicals |
20.4 |
1.08 |
|
Russia |
Iran |
Food Products |
5,692.63 |
0.3 |
|
Russia |
Iran |
Footwear |
0.003 |
0 |
|
Russia |
Iran |
Fuels |
1.727 |
0.09 |
|
Russia |
Iran |
Hides and Skins |
0.001 |
0 |
|
Russia |
Iran |
Mach and Elec |
504.8 |
26.82 |
|
Russia |
Iran |
Metals |
282.5 |
15.01 |
|
Russia |
Iran |
Minerals |
0.00019 |
0 |
|
Russia |
Iran |
Miscellaneous |
322.7 |
17.15 |
|
Russia |
Iran |
Plastic |
8.76 |
0.47 |
|
Russia |
Iran |
Stone and Glass |
2.3 |
0.12 |
|
Russia |
Iran |
Textiles |
2.75 |
0.15 |
|
Russia |
Iran |
Transportation |
163.71 |
8.7 |
|
Russia |
Iran |
Vegetable |
422.65 |
22.46 |
|
Russia |
Iran |
Wood |
143.74 |
7.64 |
Source: WITS, 2018
Table 11 - Russia's imports from Iran by product 2016
|
Host |
Partner |
Product Group |
Import (US$ Million) |
Import Product Share (%) |
|
Russia |
Iran |
All Products |
302.55 |
100 |
|
Russia |
Iran |
Capital goods |
9.04 |
2.99 |
|
Russia |
Iran |
Consumer goods |
23.25 |
7.69 |
|
Russia |
Iran |
Intermediate goods |
27.57 |
9.11 |
|
Russia |
Iran |
Raw materials |
217.19 |
71.79 |
|
Russia |
Iran |
Animal |
2.21 |
0.73 |
|
Russia |
Iran |
Chemicals |
12.49 |
4.13 |
|
Russia |
Iran |
Food Products |
15.18 |
5.02 |
|
Russia |
Iran |
Footwear |
0.016 |
0.01 |
|
Russia |
Iran |
Fuels |
0.806 |
0.27 |
|
Russia |
Iran |
Hides and Skins |
0.00095 |
0 |
|
Russia |
Iran |
Mach and Elec |
6.71 |
2.22 |
|
Russia |
Iran |
Metals |
1.11 |
0.37 |
|
Russia |
Iran |
Minerals |
3.02 |
1 |
|
Russia |
Iran |
Miscellaneous |
26.11 |
8.63 |
|
Russia |
Iran |
Plastic |
10.88 |
3.59 |
|
Russia |
Iran |
Stone and Glass |
3.58 |
1.18 |
|
Russia |
Iran |
Textiles |
2.95 |
0.97 |
|
Russia |
Iran |
Transportation |
1.78 |
0.59 |
|
Russia |
Iran |
Vegetable |
215.67 |
71.28 |
|
Russia |
Iran |
Wood |
0.053 |
0.02 |
Source: WITS, 2018
Looking at the data, the Russian Iranian trade is highly imbalanced. However, when only raw material exports are concerned, which encompasses oil exports, one can argue that Russia imports $217 million of raw material while exporting $331 million of it, so there is 65.6% reciprocity in that product group trade. Also, in the case of an agreement in which Iran starts selling its oil to Russia, the Russian imports from Iran would increase and 65.6% reciprocity would increase as well. This means that, the trade imbalance might be much lower, if a Caspian pipeline is constructed so that Iran can sell oil to Russia. In such a scenario, since Iran has very high oil production, it can sell sufficient amount of oil to equalize the trade imbalance (for record, Russia exports $1.88 billion, but imports $0.3 billion, the gap can be closed by a oil deal in Caspian) (WITS, 2018).
Moreover, Russia views a possible trade deal positively. Russian Chamber of Commerce and Industry Vice President Vladimir Padalko said the resumption of US sanctions on Iran will not push away entrepreneurs or disturb interaction with the agreement (Financial Tribune.com, 2018). In addition, Iran and Russia are aiming to exchange Russian weapons with Iranian crude oil because they are trying to avoid from using US dollars, which increase the possibility of a trade deal.
Trade statistics between Iran and China
One thirds of Iran’s oil exports go to China currently. China, is a really important client for Iran (Lee, 2018).
Table 12 - Chinese exports to Iran by product 2016
|
Host |
Partner |
Product Group |
Export (US$ Million) |
Export Product Share (%) |
|
China |
Iran |
All Products |
16,417.27 |
100 |
|
China |
Iran |
Capital goods |
6,214.4 |
37.85 |
|
China |
Iran |
Consumer goods |
5,703.63 |
34.74 |
|
China |
Iran |
Intermediate goods |
4,134.6 |
25.18 |
|
China |
Iran |
Raw materials |
359.4 |
2.19 |
|
China |
Iran |
Animal |
103.75 |
0.63 |
|
China |
Iran |
Chemicals |
917.95 |
5.59 |
|
China |
Iran |
Food Products |
80.49 |
0.49 |
|
China |
Iran |
Footwear |
230.47 |
1.4 |
|
China |
Iran |
Fuels |
53.43 |
0.33 |
|
China |
Iran |
Hides and Skins |
117.15 |
0.71 |
|
China |
Iran |
Mach and Elec |
5,436.23 |
33.11 |
|
China |
Iran |
Metals |
1,984.49 |
12.09 |
|
China |
Iran |
Minerals |
26.2 |
0.16 |
|
China |
Iran |
Miscellaneous |
1,221.88 |
7.44 |
|
China |
Iran |
Plastic or Rubber |
926.77 |
5.65 |
|
China |
Iran |
Stone and Glass |
545.21 |
3.32 |
|
China |
Iran |
Textiles and Clothing |
1,692.49 |
10.31 |
|
China |
Iran |
Transportation |
2,315.52 |
14.1 |
|
China |
Iran |
Vegetable |
231.95 |
1.41 |
|
China |
Iran |
Wood |
533.31 |
3.25 |
Source: WITS, 2018
Table 13 - Chinese imports from Iran by product 2016
|
Host |
Partner |
Product Group |
Import (US$ million) |
Import Product Share (%) |
|
China |
Iran |
All Products |
14,827.19 |
100 |
|
China |
Iran |
Capital goods |
6.1 |
0.04 |
|
China |
Iran |
Consumer goods |
197.14 |
1.33 |
|
China |
Iran |
Intermediate goods |
3,485.55 |
23.51 |
|
China |
Iran |
Raw materials |
11,138.26 |
75.12 |
|
China |
Iran |
Animal |
0.628 |
0 |
|
China |
Iran |
Chemicals |
1,154.81 |
7.79 |
|
China |
Iran |
Food Products |
0.875 |
0.01 |
|
China |
Iran |
Footwear |
0.002 |
0 |
|
China |
Iran |
Fuels |
9,601.07 |
64.75 |
|
China |
Iran |
Hides and Skins |
0.702 |
0 |
|
China |
Iran |
Mach and Elec |
1.08 |
0.01 |
|
China |
Iran |
Metals |
183.02 |
1.23 |
|
China |
Iran |
Minerals |
1,753.56 |
11.83 |
|
China |
Iran |
Miscellaneous |
0.597 |
0 |
|
China |
Iran |
Plastic or Rubber |
2,094.58 |
14.13 |
|
China |
Iran |
Stone and Glass |
0.824 |
0.01 |
|
China |
Iran |
Textiles and Clothing |
3.71 |
0.03 |
|
China |
Iran |
Transportation |
4.89 |
0.03 |
|
China |
Iran |
Vegetable |
26.4 |
0.18 |
|
China |
Iran |
Wood |
0.446 |
0 |
Source: WITS, 2018
An important takeaway from Table 12 and 13 is that the trade is relatively balanced between China and Iran. Therefore, as their trade is balanced, they can sustain an economic trade relationship in terms of their local currencies (Foy, 2018). But then, Russia would not be happy with a possible pipeline from Iran to Kazakhstan, as Kazakhstan already has existing infrastructure to send gas and oil to China (and as the scope of this research is on Caspian Sea). Also, as Russia is already weary of the influence Chinese BRI exerts on Caucasus, Central Asia, it might try to make a deal to replace China as a possible partner for Iran (Kramer, 2018).
In order to dodge the serious sanction threats from the US, Iran might use Caspian Sea as an exit strategy, and strike a deal with Russia under matching interests.
Oil and gas reserves and pipeline infrastructure of Iran
Figure 9 shows the complete outline of Iran’s pipeline infrastructure and oil and gas fields from 2016. Figures 10 and 11 show the most recent pipeline infrastructure of Iran as of April 9th, 2018 (U.S. Energy Information Administration, 2018). All of the discovered oil fields in Iran are located in the Southwestern portion of Iran. 85% of it is located onshore, while remaining 15% is offshore in the Persian Gulf (U.S. Energy Information Administration, 2018). However, the oil is very unevenly distributed in Iran. 71% of total oil reserves are located in a small province in Southwest Iran called Khuzestan (U.S. Energy Information Administration, 2018). Similarly, all of the gas production in Iran comes from Southern Iran. Recently, Iran discovered gas fields in Western Iran and completed the gas pipelines connected to that area (U.S. Energy Information Administration, 2018).
Figure 9 - Iran Oil and Gas reserves and Pipeline Infrastructure
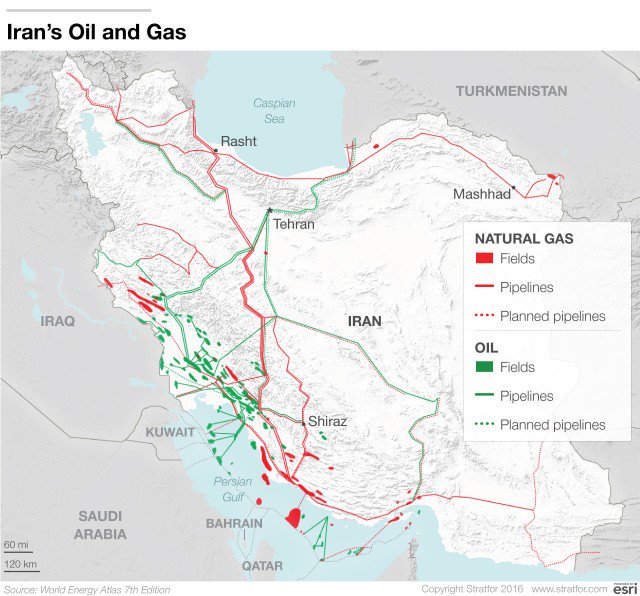
Source: World Energy Atlas, 2016
Figure 10 - Iran Gas Pipelines
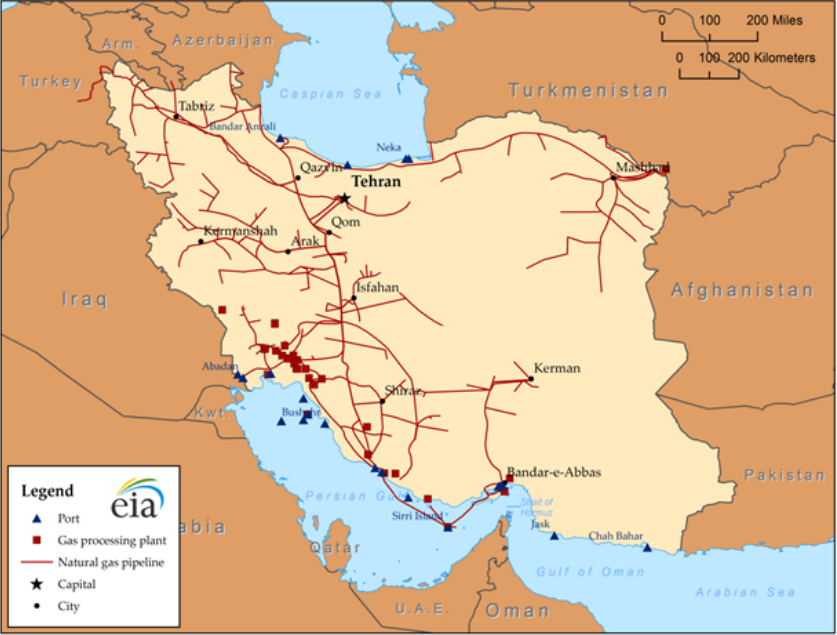
Source: EIA, 2018
Figure 11 below shows that, Iran has the oil pipeline infrastructure to carry up to 500,000 barrels per day (bpd) of the Southwest oil up to Caspian Sea. This city of Neka is actually a port that has been used for oil swap agreements in the past with Azebaijan, Kazakhstan and Turkmenistan (U.S. Energy Information Administration, 2018). The oil coming from those three countries were used to feed northern Iran the oil that is required (Kurtmulayev, 2012). Moreover, in 2017, Iran made a deal with Russia to import their oil from Neka port, meaning that the port is capable of handling oil trade (Theiranproject.com, 2017). In 2016, with the IOTC’s investments, Neka port has been expanded to have 13 oil tanker docks, capable of berthing ships up to 63 thousand tons (ITE Transport & Logistics, 2016). Moreover, the pipeline to Neka is capable of carrying 500,000 bpd, which corresponds to approximately 25% of Iran’s total oil exports per day, as seen from the data in Table 3 (Aliyeva, 2017). Moreover, Neka port terminal has a loading capacity of 1.5 million bpd (ITE Transport & Logistics, 2016). Moreover, the oil storage capacity of Neka port is 250 million liters, and only 10% of it is being used as of 2017 (Financial Tribune, 2017).
Figure 11 - Iran Oil Pipelines
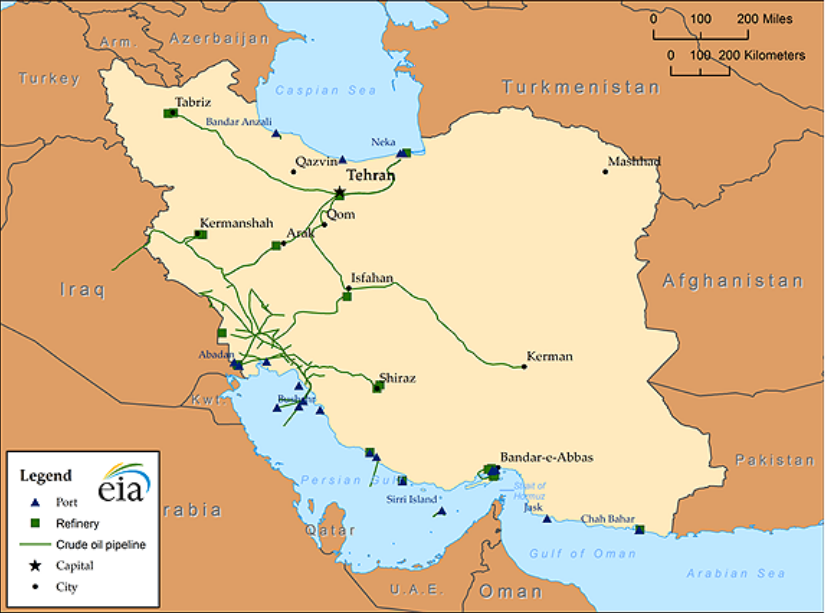
Source: EIA, 2018
Details of Iran Pipelines
Natural Gas Pipelines
Iran- Pakistan natural gas pipeline project: Iran was trying to expand its trade path for China with the help of the construction of Iran-Pakistan gas pipeline. This pipeline project is also important for Pakistan to supply its energy needs.
The project, previously known as the Peace Pipeline, was firstly proposed in the 1990s and included a 600km extension into India (Hydrocarbons Technology, 2014).
“Since the pipeline route passes through conflicted areas such as Baluchistan, India withdrew from the project in 2009, citing concerns with gas pricing and security of the pipeline. Pressure from the US was also considered as one of the reasons for India’s withdrawal” (Hydrocarbons Technology, 2014).
The US government was trying to isolate Iran economically. Despite sanctions from the US, Pakistan decided to build the pipeline because of its energy problems.
“In June 2010, Pakistan and Iran signed an agreement to go ahead with the project. The agreement was signed between the Iranian Gas Export Company and Pakistan’s Inter State Gas Systems (ISGS). According to the agreement, Iran will supply gas to Pakistan for a period of 20 years with a five-year grace period” (Hydrocarbons Technology, 2014).
Iranian government completed construction of the pipeline on its side of the project.
“It was reported during late months of 2016 that Pakistan has put an end to the pipeline project owing to political pressure from a Gulf country” (ETEnergyworld.com, 2018).
The Iran Gas Trunkline (IGAT):
It is a series of large diameter pipelines constructed from gas refineries in the south of Iran (Khuzestan and Bushehr provinces) in order to transfer natural gas to consumption centers across the country (Pars Oil and Gas Company, 2018).
The Dauletabad–Sarakhs–Khangiran natural gas pipeline:
It (also known as Dauletabad–Salyp Yar pipeline) is a natural gas pipeline from the Dauletabad gas field in Turkmenistan to Khangiran in Iran, where it is connected with the Iran Gas Trunkline system. It is significant as it allows the diversification of Turkmenistan's gas export routes, doubling the nation's export of gas to Iran. For Iran, the pipeline allows the country to deal with gas shortages in its northern regions, and to improve its reputation as a trade partner in the Caspian region (Parkhomchik, Simsek & Nurbayev, 2016).
Iran- Armenia natural gas pipeline: “The Iran–Armenia gas pipeline runs from Tabriz to the Iran–Armenia border. The Armenian section runs from the Meghri region to Kajaran, and another 197 kilometers (122 miles) of pipeline is planned to reach the center of the country, where it will link up with the existing distribution network” (Socor, 2007).
In this pipeline, there was a political controversy because of Gazprom, this pipeline is connected with ArmRosGazprom but Gazprom did not allow them to build a connector pipeline at the initial diameter. Actually, Gazprom inhibited Iran to enter to European oil markets.
Oil Pipelines
The following figures list the Middle East pipelines, as shown on the map. It is followed by the map, which you can click to see an enlarged version. The pipeline routes on the map are labeled with the codes that are explained in the table. Pipeline label codes are colored green for oil, red for gas and blue for products, such as gasoline, propane and ethylene. The diameter, length and capacity of the pipeline, if known, are shown on the figure below.
Figure 12 - Detailed Outline of Iran Pipeline Network
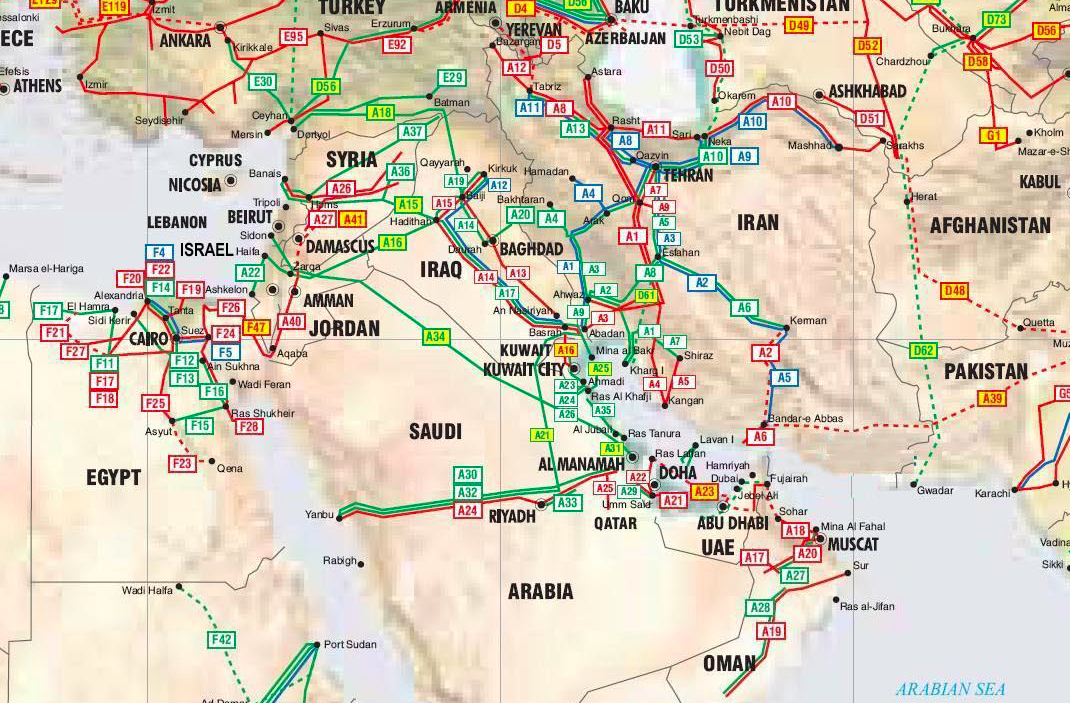
Source: Theodora, 2013
Figure 13 - Oil Pipeline Statistics of Iran
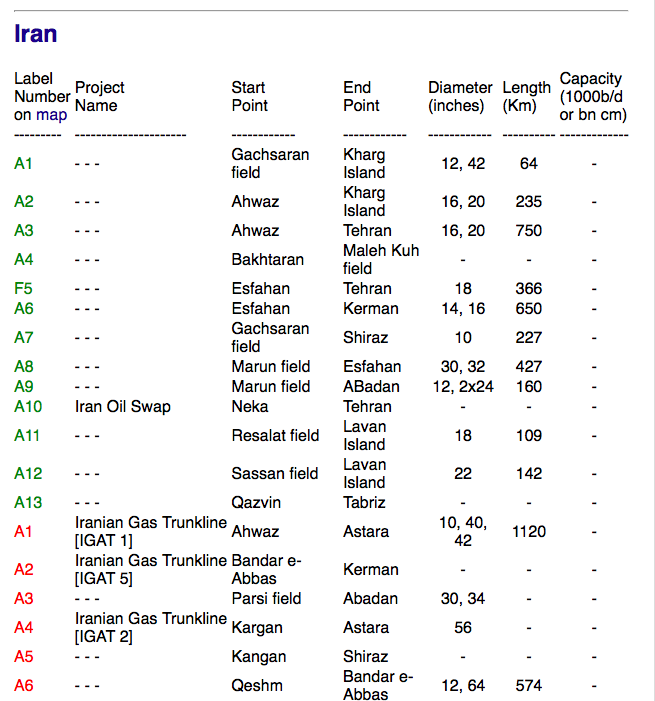
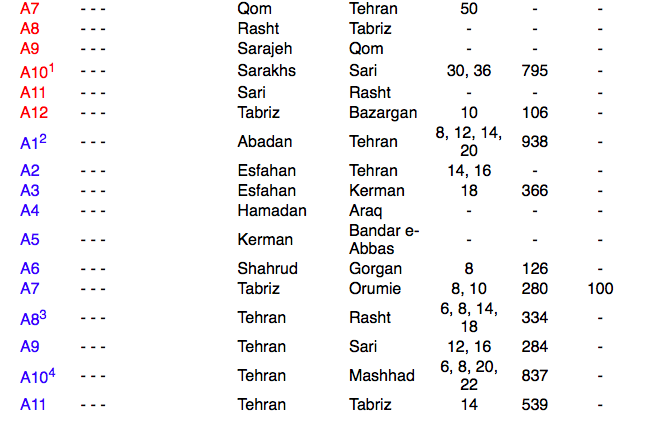
Source: Theodora, 2013
Figure 14 shows that, Iran’s remaining oil pipeline infrastructure connects oil fields within the country and distributes produced oil inside the country, such as Tabriz pipeline, Qom-Isfahan-Kerman pipeline. Iran also has a pipeline that extends to Iraq, which connects to IPSA, which is a pipeline that goes to Red Sea to be exported via ships (Southfront.com, 2015). However, utilization of this corridor for Iran is impossible, as IPSA has been closed since 1990 (Gamal, 2017). Thus, other major oil pipelines do not pose themselves as “exit-strategy” for Iran, except for a potential pipeline from Neka port, which can be used to evade the US sanctions. Neka has direct connection to Iranian oil pipeline structure (U.S. Energy Information Administration, 2018). Thus, it can theoretically be fed with oil extracted from any oil field in Iran.
Figure 14 - Middle East Pipeline Infrastructure
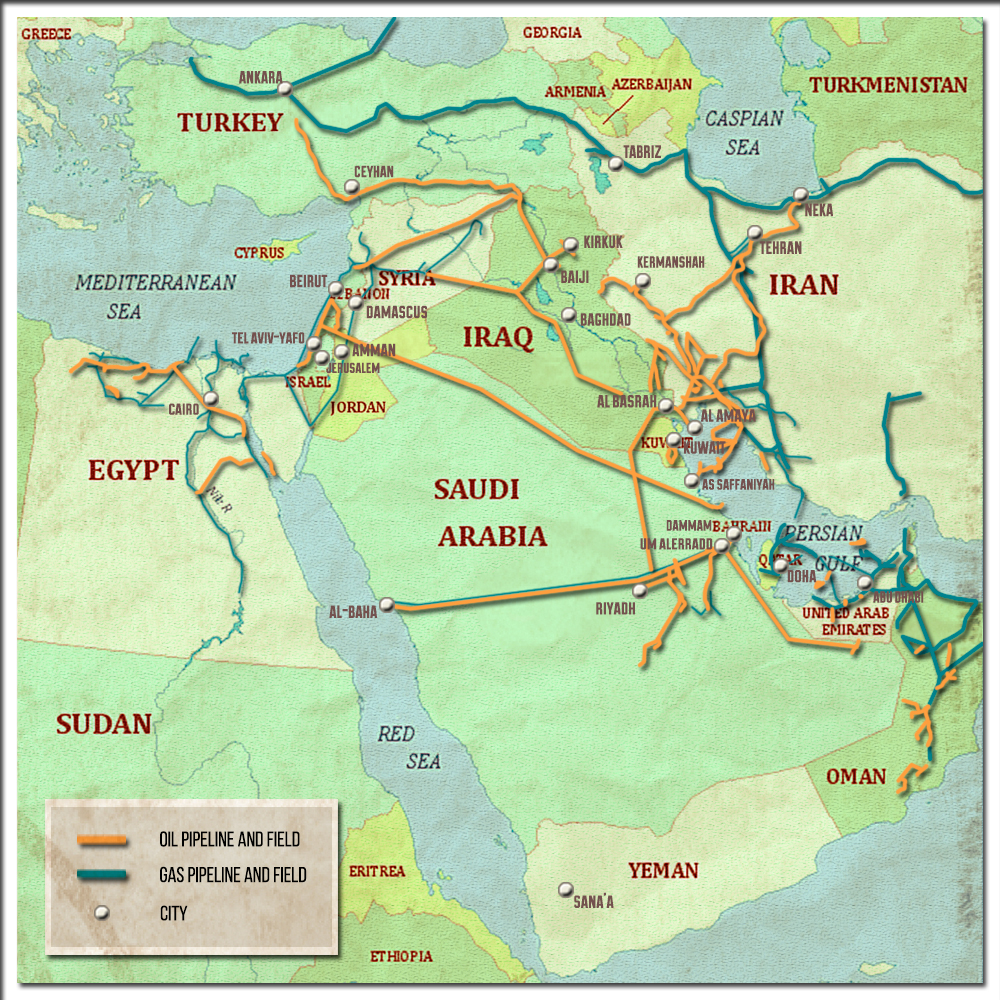
Source: SouthFront, 2015
Figure 15 - Westward Facing Pipelines of Russia
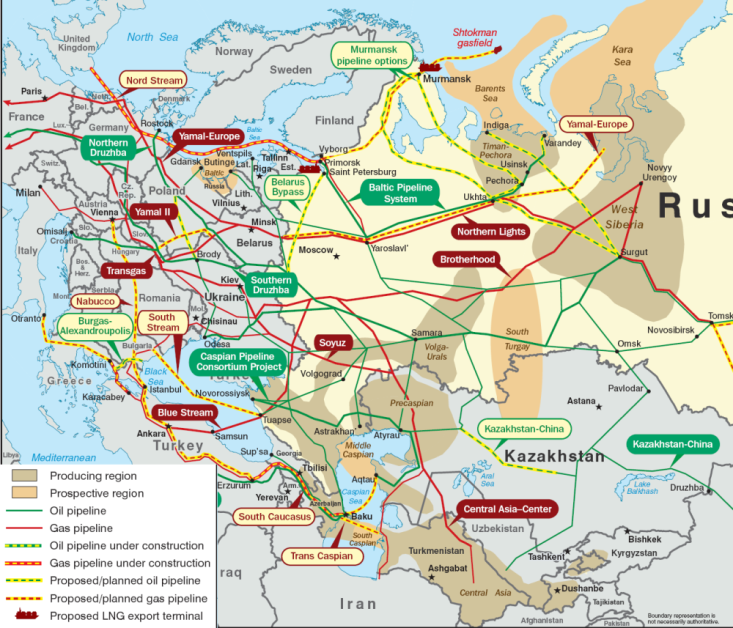
Source: ViableOpposition, 2015
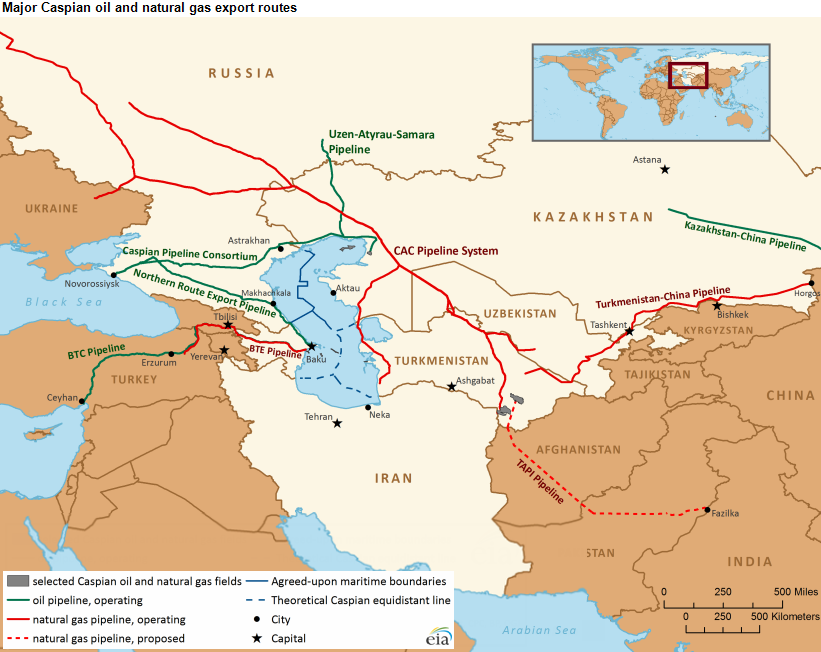
Figure 16 - Major Caspian Oil and Natural Gas Export Routes
Source: EIA, 2013
When Figures 15 and 16 are observed, there are two possible port cities that have existing connections to pipeline infrastructure of Russia. Those two cities are Astrakhan and Makhachkala. Both of the ports are connected to Caspian Pipeline Consortium, which also has a connection to the complete oil infrastructure system of Russia. Therefore, the cities have the flexibility to be connected to Europe in addition to Black Sea ports. However, due to direct connection to Novorossiysk of Caspian Pipeline Consortium, Novorossiysk would probably be the main export port for any oil imports from Astrakhan or Makhachkala.
Moreover, crude oil transfers corresponds to 87% of the Makhachkala port’s operations. On the other hand, Astrakhan port is used to export grain to Iran, which corresponds to 80% of the ports total transfer (Louppova, 2017). This means that, Makhachkala is the biggest crude-oil transfer port. The port even has the infrastructure needed to handle up to 5 tankers at a time, which can weigh up to 12 thousand tons (Zohn, Kosarev, Glantz & Kostianoy, 2010). In 2012, there were plans to increase its capacity to be able to handle Panamax types of ships of weight 63 thousand tons (Ziyanov, 2012). Moreover, Makhachkala is ice-free the whole year, and was planned back in 2012 to be used for commercial-scale crude oil transportation to Iran’s Neka port (Kurtulmalayev, 2012). Also, Russian Government announced that, it will be investing in its Caspian ports, mainly in Makhachkala to boost the North-South trade corridor. The aim of Russia is to establish trade routes and ports to increase the trade volume with Iran, even perhaps with India or China (Louppova, 2017).
However, in 2017, Russia banned oil tankers transporting oil with sulfur content above 0.6% from docking in Makhachkala (Shaban, 2018). Iran Light’s sulfur content is around 1.5%, meaning Makhahkala is not a suitable candidate unless Russia lifts the ban (U.S. Energy Information Administration, 2018). Considering that Kazakh oil’s sulfur content is (0.55% - 1.2%), ban was targeted at heavier Kazakh oil (Eurostat, 2018; Shaban, 2018).
On the other hand, Lukoil announced back in 2015 that it would start infrastructure projects to transport and process more offshore Caspian oil and carry it by Astrakhan, and its commitment is still ongoing (Azernews.com, 2018; Lukoil, 2015 2018).
Therefore, considering the ban, Astrakhan port seems to be the most plausible option. However, considering the oil sulfur content limit in Makhachankala is most probably targeted at Kazakhstan Heavy, if Russia decides to make an oil deal with Iran, it can reconsider lifting the ban.
Details of Makhachkala Port and connected Pipelines
Figure 17 - Baku - Makhachkala - Novorossiysk Pipeline
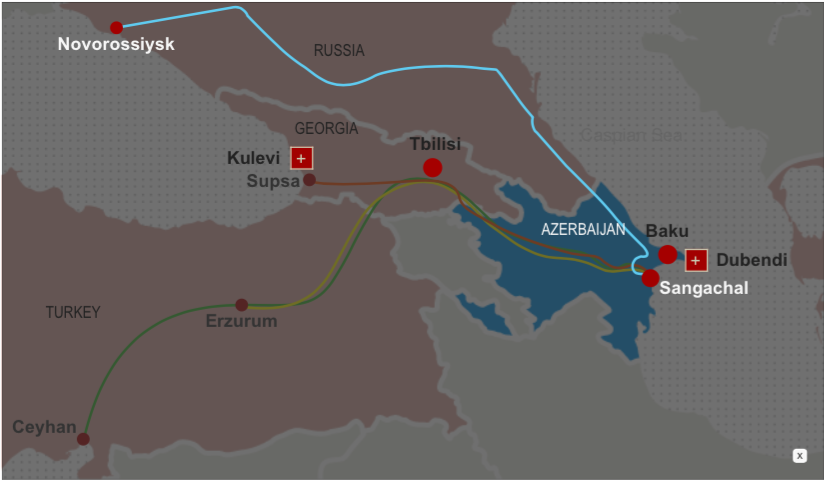
Source: SOCAR, 2018
This oil pipeline is 1,330-kilometer (830 mil) long and the diameter of the pipeline is 530 mm as Figure 17 show that it starts from the Sangachal Terminal near Baku to the Novorossiysk terminal at the Black Sea coast of Russia (Socar.az, 2018). The Russian section of the pipeline is operated by Transneft and the Azerbaijani section is operated by the State Oil Company of Azerbaijan Republic (Socar.az, 2018) which is 231-kilometer long (Aliyev and Sharifov, 2008). The pipeline runs through Dagestan in Russia and the original route run also through Chechnya as it exploited the existing Grozny–Baku and Grozny–Novorossiysk pipelines (Socar.az, 2018). However, after the Second Chechen War, this part of the pipeline was closed and then, Transneft crated another pipeline as a solution to solve the dispute in this region. “An oil pipeline bypassing the territory of the Chechen Republic was commissioned increasing the reliability of Azerbaijani oil transit via the Baku — Tikhoretsk — Novorossiysk route in 2000 (transneft.ru/investors, 2018)”. “Filling the pipeline with oil started in October of 1996 (Socar.az, 2018)”. The maximum capacity of the pipeline is 105, 000bpd (Socar.az, 2018). From 2006 to 2008, the flow of oil from Azerbaijan to Russia temporarily stopped by Azerbaijan because of price disputes with Transneft. Annually, Azerbaijan International Operating Company (AIOC) has a connection with the government and it transports Azerbaijani high gravity oil. This company produced Azeri oil in the Azeri-Chirag-Gunashli field and this field is linked with the Baku-Novorossiysk pipeline and the Baku-Tbilisi-Ceyhan (BTC). The Baku-Novorossiysk pipeline has a maximum capacity of 5 million tons per year (or 100 thousand barrels/day). According to last reports regarding to Azerbaijan's oil export from Russia, amount of oil supplies were 1.16 million tons, in 2017 between January and September while exports from BTC fell by 7.8 percent to 20.33 million tons (enerjigunlugu.net, 2017). In addition, Azerbaijan will reduce this amount to 1.35 million tons in 2018.
Table 14 - Russia Oil Acceptance Data by Country
|
Oil acceptance and delivery indicators for 2015-2017 |
||||
|
Indicators |
Acceptance in Year (mtoe) |
Change, 2017 vs 2016, % |
||
|
Acceptance into the Russia |
2015 |
2016 |
2017 |
|
|
oil from Kazakhstan |
15.28 |
17.22 |
16.93 |
-1,7 |
|
oil from Azerbaijan |
001.19 |
001.30 |
001.50 |
15,4 |
|
oil from Turkmenistan |
0.76 |
0.44 |
0.00 |
-100 |
Source: (Hilal(?))
The amount of oil that Russia exports from Azerbaijan which can be seen in Table 14, has been increasing since 2015 until 2017. The increased rate in the amount of oil that exported from Azerbaijan is 15.4%.
Oil Types exported via Novorossiysk
Figure 18 - Novorossiysk Pipeline Infrastructure
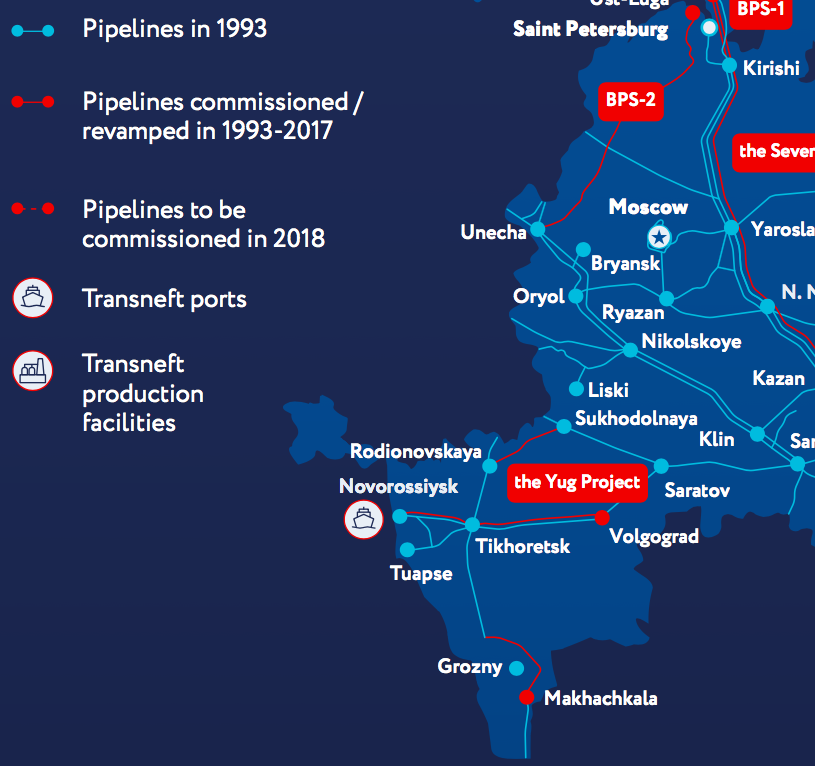
Source: Transneft.ru, 2018
Connection between Novorossiyks Port and Caspian Pipeline Consortium and Trade
In 2017, the CPC was shipped 55.1 million tons of oil from the Novorossiysk Marine Terminal, 49.5 million tons of oil from Kazakhstan and 5.6 million tons of oil from Russian shippers. Compared to 2016, the volume shipped by the CPC from the Marine Terminal in Novorossiysk increased by 24% or 10.8 million tons.
Viscosity, API gravity, sulphur content of oils have been discussed in section 2.1. However, there are other metrics of oils such as asphaltene, benzene, copper, iron, lead, nickel, nitrogen, lead, vanadium, wax, water and zinc content. However, all these numbers are either weakly correlated (nickel, vanadium) or stays relatively unchanged (asphaltene, iron, wax) with API gravity and viscosity or, are relatively insignificant (sodium) compared to viscosity, API or sulphur content (Petroleum.co.uk, 2018; NIOC, 2018).
Figure 19 - How various oil metrics change w.r.t. API Gravity for Iranian Crude Oils
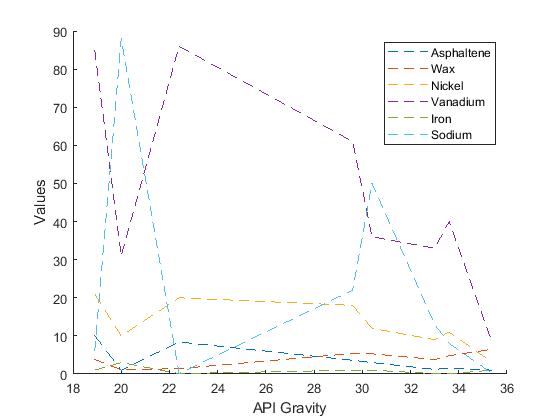
Source: NIOC, 2018
Thus, one should look for oils that have similar API gravity, viscosity and sulphur content values, to get a main idea for possible alternatives. However, this is not a strict alternative, since one can adjust the ratio of mixed oils. Thus, alternatively, a sourer and heavier oil can be used but in smaller ratio instead of Iranian oil to mimic Iranian oil’s effect.
Figure 20 - Metrics of Iranian Oil Blends and Possible Alternatives
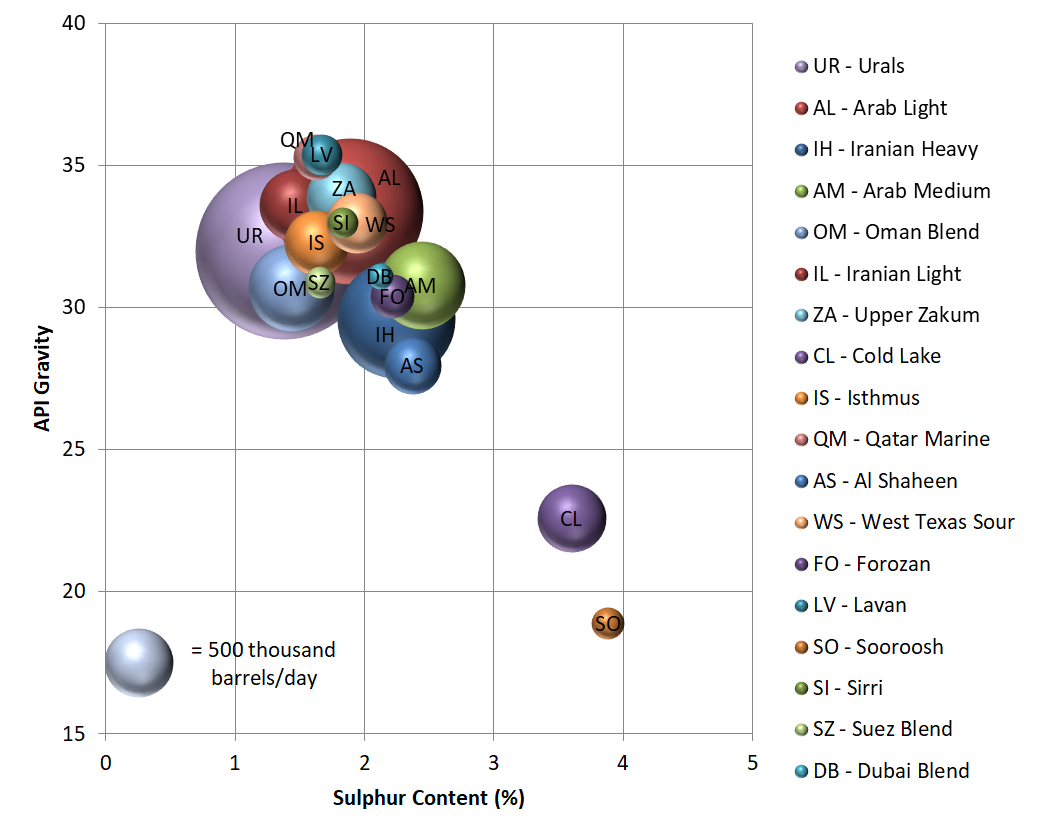
Source: Eni Norge, 2018; NIOC, 2018
Figure 20 shows oil blends that are similar to Iranian blends in terms of their API gravity and sulphur content. Further details of the blends that might be alternative to the Iranian blends can be seen in Table 15:
Table 15 - Iran Oil Blend Alternatives
|
Name of Oil Blend |
Origin |
Typical API Gravity |
Typical Sulphur (%) |
Viscosity |
Alternative to |
|
Al Shaheen |
Qatar |
27.97 |
2.37 |
44.06 (20C) |
Iranian Heavy |
|
Arab Light |
Saudi Arabia |
33.4 |
1.89 |
12 (16C) |
Sirri |
|
Arab Medium |
Saudi Arabia |
30.8 |
2.44 |
16.4 (21C) |
Iran Heavy/Forozan |
|
Cold Lake |
Canada |
22.6 |
3.6 |
206 (16C) |
Soroosh |
|
Dubai |
UAE |
31.1 |
2.12 |
13 (20C) |
Iran Heavy/Forozan |
|
Isthmus |
Mexico |
32.3 |
1.63 |
9 (25C) |
Sirri |
|
Oman |
Oman |
30.7 |
1.43 |
- |
Iranian Light |
|
Qatar Marine |
Qatar |
35.3 |
1.62 |
23.41 (15C) |
Lavan |
|
Suez Blend |
Egypt |
30.9 |
1.65 |
23.56 (20C) |
Iran Light/Sirri |
|
Urals |
Russia |
32.0 |
1.37 |
4.92 (20C) |
Iran Light |
|
Upper Zakum |
UAE |
33.9 |
1.82 |
9.6 (20C) |
Sirri |
|
West Texas Sour |
USA |
33.0 |
1.94 |
- |
Sirri |
Source: Eni Norge, 2018; ETC, 2018; Total, 2018; ExxonMobil, 2018; Petrotech, 2018
A notable mention here is, 99% of Canada’s oil export’s destination is USA. Therefore, Cold Lake blend of origin Canada, is not really a suitable alternative for the scope of our project (ETC, 2018). However, oils from UAE, Saudi Arabia, the US, Russia and other Middle Eastern countries are strong alternatives. Especially, Saudi Arabia, UAE and Russia has the capability of ramping up their production to some extent (BP, 2018). Also, as these countries have similar customer portfolio and similar quality to some Iranian blends, they can be regarded as strong alternatives. However, a silver lining here is Russia for example is in need of oils that have sulphur content of less than 1.8% to keep its Ural blend at a certain quality. So, the alternatives of Ural blend can be utilized by Russia, or Russia’s customers in case the Ural blend quality deteriorates (Paraskova, 2018).
As stated in section 5.8, strong alternatives for the Urals blend can be utilized by Russia to prevent its blend’s quality from deteriorating. Observing Figure 20, the only Iranian blend that can realistically achieve this is Iranian Light blend. Therefore, Russia can utilize Iranian Light to supply the mixture to Europe, which has been growing discontent from the decreasing quality of the Urals blend. Moreover, when cost of production is considered, Iran produces a barrel of oil for $9.08 while Russia produces a barrel of oil for $19.21 on average (WSJ News Graphics, 2016). Therefore, the cost of production appears to be feasible for a possible trade deal.
However, a slight issue is, as it has been mentioned previously, the production in fields where Iranian Light is extracted from has been decreasing. There is still oil, but extraction requires more expensive EOR methods. Thus, this might either increase the cost of Iranian Light to a degree that it is unfeasible for Russia to import and export it, or Iran might decrease the production of Iranian Light, and there might not be oil available for Russia to import.
There are 4 possible ways of transporting oil: Rails, trucks, pipelines and ships. Due to immense distance between Iran and Russia on land, and having two to three countries separating them, transportation by trains or trucks seem implausible. However, as Caspian Sea connects the two countries, two possible methods are left: Pipelines and ships. Both of the methods have their advantages and disadvantages.
Pipeline
This section discusses the advantages and disadvantages of building a pipeline in Caspian Sea to transport Iranian oil.
Advantages
Pipeline system is one of the most common transportation system to carry crude oil from one location to another. Using pipelines to transfer crude oil from Iran to Russia has several advantages for not only just Iran and Russia but also for other states around the Caspian, as well:
Economic Perspectives of Persistence
Due to the continuous pressure in the booster pumps, the oil flow from one location to other permanently. In the short term, shipment is more affordable than pipelines. However, considering the constant money and oil flow and the income that comes from pipelines, this persistent transportation method has benefit for the shareholders of pipeline.
Safety
Using pipelines as a transportation is safe for environment because of the low rate of oil leaks. (setxind.com,2016).
Regional prosperity
The pipelines increase the value of the area and investment in the region which will redound the prosperity of the Caspian. We can consider BTC as an example to these prosperities.
“The BTC pipeline project broke ground in September 2002 and was billed as the largest private sector construction and investment project in Caucasus. It contained 20 billion investment packages that includes up and down stream projects”
We can indicate that using pipelines between Russia and Iran will be the most appropriate transportation system considering the security, economic interest and the prosperity of the region
Disadvantages
The most major issue with pipelines is that, according to 5th Convention on Legal Status of Caspian Sea, the seabed is separated into territorial zones. This means that, no matter what, the pipeline has to go through seabed territory of Azerbaijan or Kazakhstan, and perhaps even Turkmenistan as well as seen from Figure 1. Having a country to approve a deal that allows Iran to evade US sanctions definitely complicates the pipeline project. Even assuming that a country might agree to allow Russia and Iran to lay pipelines in exchange for a certain deal, it would probably be costly in itself. In addition, building pipelines comes with initial capital investment, which makes it more expensive than shipping (Setxind.com, 2016). Also, another issue with pipelines is the lack of flexibility. Pipelines are permanent, and to recover the initial investment, it requires a long-time contract. However, given that US’ stance against Iran changed drastically with the Trump Administration, the sanctions against Iran might be lifted in 2020 after the election when a new president comes to power. Thus, Iran might end up being limited by the existence of pipeline deals. Moreover, pipeline capacities are generally smaller than several dozens of tankers, and their capacities are harder to upgrade (Setxind.com, 2016).
Ships
This section discusses the advantages and disadvantages of carrying the Iranian oil over Caspian Sea with oil tankers, ships.
Advantages
Transporting the crude oil between Russia and Iran can be done via seaborne freight. Main advantages of Vessels are the affordable prices and grand capacities. Ships are one of the cheapest method to relocate the crude oil. Typical tank can carry 30.000 barrels in one trip (setxind.com,2016). Using crude vessels between Iran and Russia can be advantageous in the short-term but considering the long–term outcomes of it, pipeline system might be more appropriate.
Disadvantages
Shipping comes with a major downside as well. Statistically speaking, ships spill less oil per the oil they carry than pipelines. However, this does not necessarily mean ships are safer. In fact, the most environmentally damaging oil spillages other than oil rig explosions are related to ships, not pipelines. In other words, if an accident happens, the chance of the accident being a large scale disaster is more common for ships, compared to pipelines (Conca, 2014; Green and Jackson, 2017). If oil is transported via pipelines, the valves can be used to contain the spillage. On the other hand, as tankers carry thousands of tons of oil, a potential accident can have very hard to contain implications (Conca, 2014). Considering Caspian Sea is an enclosed sea, an oil spill accident might be disastrous for the aquatic ecosystem. Also, as stated earlier, Russian port Makhachankala forbids ships to dock if they carry oil that has sulphur content over 0.6%. This might be another obstacle as well. However, considering that there has been oil shipping in Caspian Sea for years, this issue might be overcome (U.S. Energy Information Administration, 2018).
Figure 21 - Russia's oil pipeline connection to China
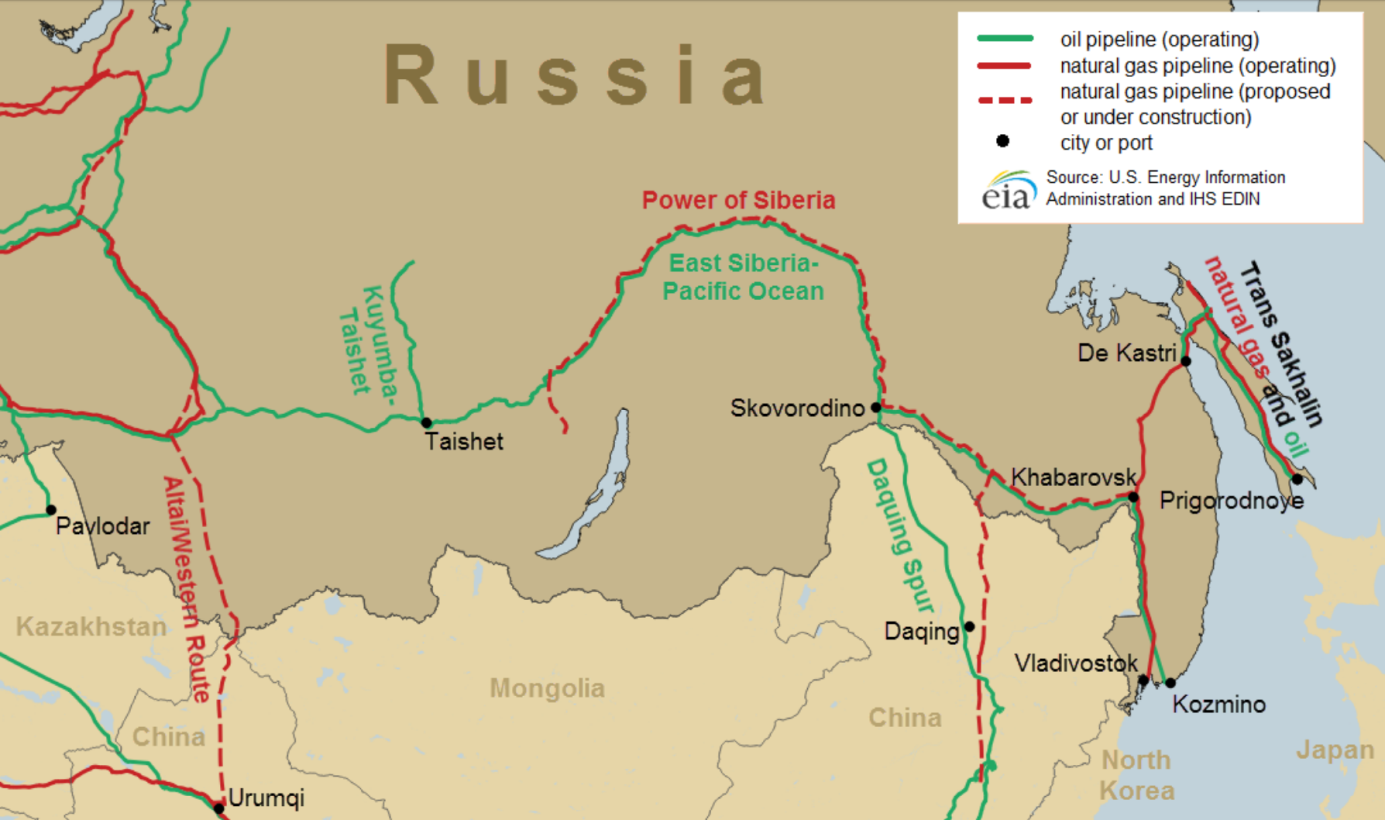
Source: EIA, 2017
Russia exports oil to China via ESPO pipeline’s Daqing Spur as seen in Figure 21. Currently, the capacity of Daqing Spur of ESPO is 600 thousand b/d (Verma, 2018). Moreover, after the recent waivers given to countries against U.S. sanctions to Iran, China has been granted permission to be able to import 360 thousand b/d. However, this is still a decrease compared to China’s imports from Iran, which stood at an average of 655 thousand b/d in 2018 (Chen, 2018). This means that, there is an approximately 300 thousand b/d decrease in Chinese imports due to U.S. sanctions. Assuming there is an oil pipeline connection between Iran and Russia through Caspian and that they deal in local currencies with the help of Russia’s increased imports, Russia has limited capacity in its Daqing Spur of ESPO pipeline to transport the 300 thousand b/d to China. Initially constructed in 2011, Daqing Spur had a capacity of 300 thousand b/d. In January 2018, due to 300 thousand b/d capacity being insufficient, this capacity was increased to 600 thousand b/d. This might imply two things. First, either Russia can transport Iranian oil because it has just recently added 300 thousand b/d capacity. Or, second, Russia would not want to transport Iranian oil because the purpose of adding extra capacity was to transport its own ESPO blend. However, one caveat is, the composition of the 300 thousand b/d imports of China that will be dropped greatly impacts the possibility of transportation. If the oil that China will stop importing due to sanctions has high sulfur and API gravity, it might be technically unfeasible to transport it via Russian pipeline infrastructure from Caspian, because pipelines have technical properties that limit the type of oil that they can carry (Petroleum.co.uk, 2018). Since any Iranian oil blend is much sourer and heavier than ESPO blend of Russia, this might be problematic for Russia to carry the Iranian oil to China (Eni Norge, 2018).
On the other hand, Russia can mix the sweet and light crude oil it extracts from West-Siberia region and mix it with the oil imported from Iran to bring the final blend’s properties close to current ESPO blend’s properties. This allows Russia to transport the Iranian oil as a blend through its pipelines without a problem.
Also, if the Iranian oil to be imported is Iranian Light, Russia can utilize it to improve the quality of its main export oil grade, Urals. If Russia uses Iranian Light in its ESPO blend, it might then use the Russian oil that was replaced by Iranian Light to increase the API Gravity of Urals blend and keep its sulphur content below 1.8%. This might help ease the growing discontent in Urals blend importing European nations.
EU imports 30.9% of its oil and 37.0% of its natural gas from Russia (Eurostat, 2018). But, as Russia started selling higher quality oil to China, EU was growing more and more discontent (Soldatkin, 2018). Therefore, EU is in active search for diversifying its oil import sources.
Table 16 - EU oil import partners
|
Partner Name |
Share of Oil Imports |
|
Russia |
30.00% |
|
Norway |
13.00% |
|
Kazakhstan |
7.90% |
|
Iraq |
6.90% |
|
Nigeria |
6.50% |
|
Saudi Arabia |
5.70% |
|
Others |
30.10% |
Source: Eurostat, 2018
Table 17 - EU gas import partners
|
Partner Name |
Share of Gas Imports |
|
Russia |
37.00% |
|
Norway |
37.00% |
|
Algeria |
12.70% |
|
Qatar |
5.60% |
|
Others |
7.70% |
Source: Eurostat, 2018
Table 17 might have important value in the case of assessing the feasibility of a gas pipeline that originates in Turkmenistan with Europe as destination.
Suez Canal Overview
In order to derive a crude approximation of the percentage of Iranian oil that is transported through Suez Canal, the destination countries play an important factor. If the destination country is reached via Suez Canal, the percentage of oil exports to that certain country also constitutes for the percentage of oil exports via Suez Canal. Thus, the countries that fit this description are European countries.
Observing the Iranian export statistics,
Table 18 - Iran oil exports by destination 2017
|
Destination Region |
Crude Oil Exports (mb/d) |
Share (%) |
|
Africa |
0 |
0 |
|
Asia and Pacific |
1,370 |
64.47 |
|
Europe |
755 |
35.53 |
|
Latin America |
0 |
0 |
|
Middle East |
0 |
0 |
|
North America |
0 |
0 |
Source: OPEC, 2018
Thus, considering that Iran has to ship its oil to Europe and that oil has to pass through Suez, and ships to Asia-Pacific region has to go through Strait of Hormuz and Strait of Malacca, one can conclude that 35.53% of the Iranian exports go through Suez Canal (EIA, 2018; OPEC, 2018).
Underwater Oil Pipelines
World Subsea Oil Pipelines Overview
Table 19 - Subsea Pipelines of Norway
|
Name of Subsea Crude Oil Pipelines |
Operator |
From |
To |
Start up (year) |
Capacity (Sm3/d) |
Diameter (inches) |
Length (km) |
|
Grane Oil Pipeline |
Statoil Petroleum AS |
Grane |
Sture Terminal |
2003 |
34.000 |
29 |
220 |
|
Kvitebjørn Oil Pipeline |
Statoil Petroleum AS |
Kvitebjørn |
Mongstad |
2004 |
10.000 |
16 |
90 |
|
Norpipe Oil |
ConocoPhillips Skandinavia AS |
Ekofisk |
Teesside (UK) |
1975 |
145.000 |
34 |
354 |
|
Oseberg Transport System |
Statoil Petroleum AS |
Oseberg A |
Sture Terminal |
1988 |
121.000 |
28 |
115 |
|
Sleipner East Condensate Pipeline |
Statoil Petroleum AS |
Sleipner A |
Kårstø |
1993 |
32.000 |
20 |
245 |
|
Troll Oil Pipeline I |
Statoil Petroleum AS |
Troll B |
Mongstad |
1995 |
42.500 |
16 |
86 |
|
Troll Oil Pipeline II |
Statoil Petroleum AS |
Troll C |
Mongstad |
1999 |
40.000 |
20 |
80 |
|
Huldra Condensate |
Statoil Petroleum AS |
Huldra |
Veslefrikk |
2001 |
7900 |
8 |
16 |
|
Gjøa Oil Pipeline |
GDF SUEZ E&P Norge AS |
Gjøa |
Troll Oil Pipeline II |
2010 |
14.800 |
16 |
55 |
|
Edvard Grieg Pipeline |
Statoil Petroleum AS |
Edvard Grieg |
Grane oljerør |
2015 |
|
|
43 |
Source: Norwegian Ministry of Petroleum and Energy, 2016
In addition to Norway, there are several other countries that have subsea pipelines. However, all of them are shorter than the ones that originate from offshore rigs in North Sea and go to UK or Norway. Thus, the longest underwater oil pipeline in the world is Norpipe given in Table 18. Other countries that have oil pipelines that are at least partially submerged into water are, Argentina, Australia, Chile, Gabon, Iraq, India, Indonesia, Kuwait, Malaysia, Papua New Guinea, Russia, Saudi Arabia, South Africa and United Arab Emirates (Harvard World Map, 2009). And all of these pipelines are to transport oil from offshore rigs to refineries in their corresponding countries.
Potential Cost and Feasibility Analysis of an Underwater Pipeline Between Iran and Russia
As stated in Section 8.1, there is not a single underwater oil pipeline system that is used to transport crude oil between two countries. The reasoning is that, transporting oil via shipping is much more versatile, cheap and convenient. Thus, from the get-go, there is not a single project that is similar to an underwater oil pipeline between Iran’s port city Neka and Russia’s port city Makhachkala in terms of purpose and design. Therefore, approximating the cost of this project by looking at similar projects is impossible. Moreover, there are other factors that limit our capability of approximating price based on other projects, such as geographical requirements, and quality of materials, cost of labor.
Figure 22 - 2 Possible Pipeline routes, given the physico-geographical properties of Caspian Seabed
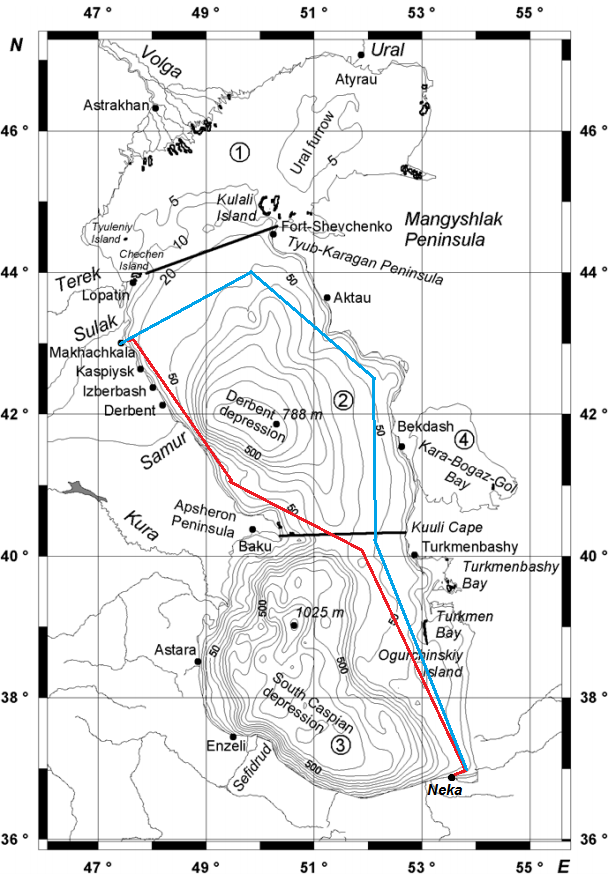
Source: Kosarev, 2005
As seen in Figure 22, Caspian Sea bed is not flat. In order to minimize the cost, the depth of the underwater oil pipeline should be minimized as well. According to this, two possible routes are drawn. Red route in Figure 2 is approximately 970 km long. Blue route on the other hand is approximately 1180 km long. A major issue with these two pipelines is that, they pass through seabed territories of other countries. Blue route passes through Turkmenistan and Kazakhstan, red route passes through Turkmenistan and Azerbaijan in order. Allowing Iran and Russia to build such a pipeline also allows other neighbors to build their own underwater pipelines. This benefits Azerbaijan and Turkmenistan more. Therefore, from political point of view, the red route seems more politically feasible, and for this reason will be used in further discussion.
In order to determine an approximate oil trade capacity, first we observe the average oil pipeline capacity in the world. When a sample set of 38 pipelines consisting of pipelines from Africa, Asia, Europe, North America is formed, the average oil pipeline capacity is 700,000 bpd.
Moreover, the latest data shows that, the sanctions put on Iran by the US caused Iranian oil exports to decrease by more than 1 million bpd as seen in figure below (Bloomberg, 2018). Thus, one might infer that Iran has 1 million export capacity that is currently being unused. This capacity might be used, if Russia is willing to evade the US sanctions.
Figure 23 - Iran's recent oil export trend
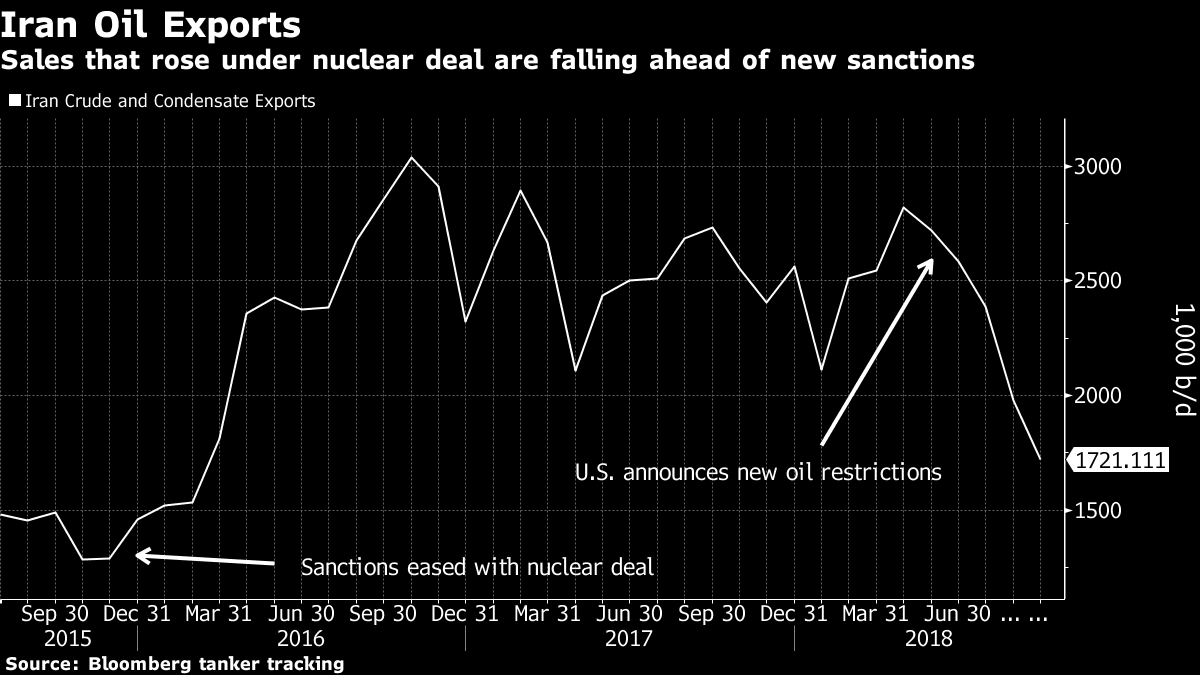
Source: Bloomberg, 2018
However, as seen in Table 6, Iran exports approximately 500,000 to 600,000 barrels of Iranian Light per day. Considering the fact that sources where Iranian Light is being extracted from are depleting, Iran might have to either export around 500,000 bpd of Iranian Light through the pipeline using its maximum extraction capacity, or support the export volume by exporting other blends, especially its main export blend, Iranian Heavy to reach the global average, 700,000 bpd or reach its previous peaks, by exporting around 1 million bpd.
Also, there is a hard limiter that we must have to take into consideration. Neka port has connection to Iranian oil pipeline infrastructure. The pipeline that goes to Neka has a capacity of 500,000 bpd. Thus, with the existing infrastructure and the numbers outlined above, 500,000 bpd seems to be a plausible proposal for the pipeline project capacity. As an added plus, this trade will not be happening through an existing pipeline infrastructure in Russia. Therefore, the proposed pipeline can be built considering the requirements of transporting sour, medium oil.
Approximation of Cost and Feasibility of the Red Route
There are 4 different types of methods to install underwater pipelines. These are,
Tow-in installation: This method requires 2 different boats to tow the pipelines over the planned location in the sea and release it (Rigzone.com, 2018). These types of ships are the least specialized and easier and cheaper to operate. This method requires the pipelines to be constructed and welded onshore and then towed into the sea (DrillingFormulas.com, 2016). This method is also used in the most shallow waters, near the shore. Therefore, this being the easiest method, is the least versatile one.
S-Lay Installation: This method requires a special S-lay vessel to perform (no exact price). With this method, the pipelines are welded offshore, and then sunk into the seabed. The depths that this method is used are between 0 to 150 meters (Fatmala, 2016). It is both faster and more versatile than Tow-in installation, but requires specialized vessels.
J-Lay Installation: This method similar to previous one requires a special J-lay vessel (no exact price) to perform. This method’s main principle is the same as S-Lay, but due to some differences, it is used in depths between 150 an 300 meters (Fatmala, 2016).
Reel Lay Installation: This method requires the most expensive vessel (no exact price) compared to others, but can lay pipelines to depths between 1000 meters and 2000 meters (Fatmala, 2016).
costs for these methods are unavailable in any site, as it is highly dependent on the length of cable to be laid, its diameter, the cost of gasoline, scale and terms of agreement, the age of the ship, the quality of the ship, the time scale to complete the operation, the required manpower etc. Building a warehouse just to build these specialized Lay installation ships are probably even more expensive, and the cost is even more case dependent. However, in the upcoming sections, the costs estimated are in the $2-3B region, thus the cost of hiring laying ships is incorporated into that price based on estimations from other projects.
The red route we outlined in which we minimized the depth, the average depth is around 50 meters, with the maximum depth being approximately 150 meters. But since the pipeline will be 970 kilometers long, Tow-in installation cannot be used. Therefore, this project requires as specialized S-Lay Vessel. However, as Caspian sea is connected to Black Sea and Mediterranean Sea via Volga-Don Canal. The necessary pipe laying ships can be brought from there, since the S-Lay Vessels are of capacity less than 5000 tons (Israfilbayova, 2018).
In addition, the pipeline is approximately 970 kilometers long. As stated previously, the longest pipeline to date is Norpipe, which is 350 kilometers long. In addition, the depth of North Sea, its physico-geographical outline greatly differs from Caspian seabed. This means that, we cannot look at the cost of Norpipe project to estimate the cost of the red route.
Another issue is that, although the Iranian pipelines that are connected to Neka port has the capacity of 500,000 bpd, Makhachkala port of Russia connects to Baku-Novorossiysk oil pipeline, which has maximum capacity of 105,000 bpd. Moreover, Azerbaijan used 30,000 bpd capacity of it in 2017 (Israfilbayova, 2018) Therefore, this leaves just 75,000 bpd capacity for importing Iranian oil. The available capacity in Baku-Novorossiysk pipeline seems the benefit would not warrant the costs (considering Iran exports 2.25 mbpd), unless the capacity of the pipeline is increased. Therefore, an additional oil pipeline between Makhachkala and Novorossiysk, or another city has to be built in order to boost the capacity, which again incurs an additional cost.
However, for the sake of getting some perspective and also showing that the cost of an oil pipeline project depends greatly on situation, let’s compare several oil pipeline projects.
Table 20 – Oil Pipeline Projects
|
Oil Pipeline Name |
Length (km) |
Capacity (bpd) |
Cost ($) |
|
Keystone XL Pipeline |
1897 |
500,000 |
$7B |
|
Druzhba Pipeline |
5500 |
1,300,000 |
$3B |
|
Kazakhstan-China Pipeline |
2798 |
400,000 |
$3B |
|
Baltic Pipeline System-2 |
1170 |
1,000,000 |
$4B |
|
BTC |
1768 |
1,000,000 |
$3.7B |
|
Caspian Pipeline Consortium (2001) |
1580 |
675,000 |
$2.65B |
|
Caspian Pipeline Consortium (2009) |
1580 |
1,400,000 |
$8.05B |
|
East African Crude Oil Export Pipeline |
1445 |
216,000 |
$3.5B |
|
Bakken Pipeline |
1886 |
500,000 |
$3.78B |
|
Energy East Pipeline |
4600 |
1,100,000 |
$9B |
|
Neka-Jask Pipeline |
1561 |
1,000,000 |
$2B |
|
Habshan-Fuhairah Pipeline |
380 |
1,5000,000 |
$3.3B |
|
Bayou Bridge Pipeline |
262 |
480,000 |
$0.75B |
|
Trans Mountain Pipeline |
980 |
590,000 |
$3.4B |
Source: Blackman, 2012; Husseini, 2018; IAOT, 2018; Monga, 2018; HistoricalStatistics, 2018; BLS, 2018; Hydrocarbons-Technology, 2018
For example, looking at table, although the Druzhba Pipeline has almost triple the length and capacity, its cost was lower than half of Keystone XL Pipeline. Therefore, estimating the cost of the red route by interpolating data from other projects is highly unfeasible and insignificant. There are numerous external factors such as, cost of labor, the quality of the material, the life expectancy of the pipeline, the oil viscosity to be pumped through the pipeline, the corrosive properties of the oil to be pumped through the pipeline, number of pumping stations needed, the geography of the land on the pipeline route, etc. However, to prove this theory, let’s try to do a simple regression analysis, assuming the relation is linear or log-linear. The results are,
Figure 24 - Fitted linear regression equation assuming relations are linear
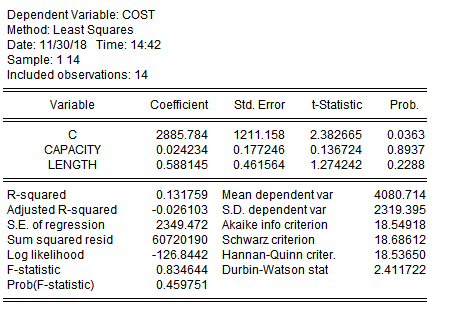
When observed, it can be seen that our length and capacity variables are statistically insignificant. According to our assumption of linear relationships, the fitted equation is,

where cost is in million dollars, capacity is in thousand barrels per day and length is in km.
But, capacity and length have statistically insignificant parameters.. But leaving this aside, still calculating the possible costs of our Neka-Makhachkala Pipeline project cost based on this model, we get,
Table 21 - Cost estimation based on fitted linear equation
|
Pipeline Properties |
Capacity (bpd) |
Length(km) |
Estimated Cost ($) |
|
Route Red |
100,000 |
970 |
$3.458B |
|
Route Red |
300,000 |
970 |
$3.464B |
|
Route Red + Makhachkala Novorosiyysk Route |
300,000 |
970+840 |
$3.958B |
|
Route Red + Makhachkala Novorosiyysk Route |
500,000 |
970+840 |
$3.962B |
However, as seen in Figure 23, with this fitted equation only 13.17% of the variation is explained (R2), and parameters are statistically insignificant. To remedy this, we can try to use log-linear relations between the variables. With this approach, the variance explained increases,
Figure 25 - Fitted log-linear regression model assuming log-linear relations
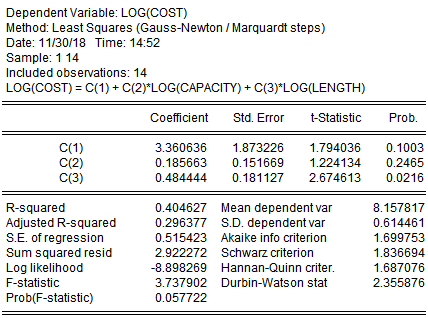
In this case, the only statistically significant variable is log(length). However, still continuing with the statistically insignificant model, we have

where cost is in million dollars, capacity is in thousand barrels per day and length is in km.
Again repeating the process, the estimated cost is,
Table 22 - Cost estimation based on fitted log-linear equation
|
Pipeline Properties |
Capacity (bpd) |
Length(km) |
Estimated Cost ($) |
|
Route Red |
100,000 |
970 |
$1.896B |
|
Route Red |
300,000 |
970 |
$2.325B |
|
Route Red + Makhachkala Novorosiyysk Route |
300,000 |
970+840 |
$3.145B |
|
Route Red + Makhachkala Novorosiyysk Route |
500,000 |
970+840 |
$3.458B |
Another issue with our estimation is that the pipelines given in table 20 is that, most of the are located around the globe. Some of them are in North America, some of them in Europe, some of them in Africa, some of them in Caspian region. Since our proposed pipeline will be in the Caspian region, we can devise a dummy variable, called Caspian, which will be,

Firstly, assuming that being in caspian is completely independent from the slope of log(capacity) and log(length), we have,
Figure 26 - Fitted log-linear regression equation with independent dummy variable
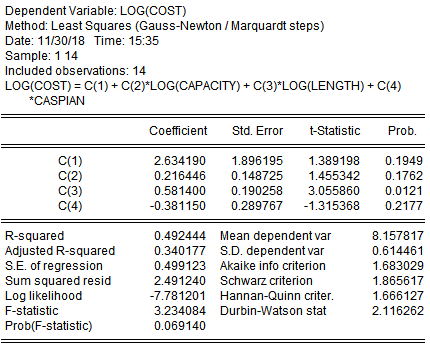
In this equation, again the variance explained increased but, there are still statistically insignificant parameters with even p = 0.15. However, ignoring this and proceeding, we have,

where cost is in million dollars, capacity is in thousand barrels per day and length is in km and Caspian is defined as before. Estimating the cost based on this equation, we have,
Table 23 - Cost estimation based on fitted log-linear equation with independent dummy variable
|
Pipeline Properties |
Capacity (bpd) |
Length(km) |
Estimated Cost ($) |
|
Route Red |
100,000 |
970 |
$1.406B |
|
Route Red |
300,000 |
970 |
$1.783B |
|
Route Red + Makhachkala Novorosiyysk Route |
300,000 |
970+840 |
$2.563B |
|
Route Red + Makhachkala Novorosiyysk Route |
500,000 |
970+840 |
$2.862B |
However, as stated, there are still a lot of statistically insignificant variables and variance explained is slightly below 50%. Thus, we can adjust the model so that dummy variable has effect on the relationship (slope) between length and capacity. Therefore, the new model is,
Figure 27 Fitted log-linear regression equation with non-independent dummy variable
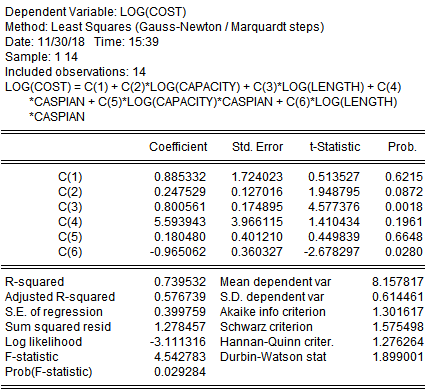
Here, again we still have statistically insignificant parameters, but the adjusted variance explained, which compensates for the increase in the number of independent variables has reached its maximum value for our 4 fitted equations, which is 58%. However this is the best that can be done with the data available and the obtained model as a whole is statistically significant. Therefore, with this fitted equation, we have,


where cost is in million dollars, capacity is in thousand barrels per day and length is in km and Caspian is defined as before. Estimating the cost based on this equation, we have,
Table 24 - Cost estimation based on fitted log-linear equation with non-independent dummy variable
|
Pipeline Properties |
Capacity (bpd) |
Length(km) |
Estimated Cost ($) |
|
Route Red |
100,000 |
970 |
$1.509B |
|
Route Red |
300,000 |
970 |
$2.414B |
|
Route Red + Makhachkala Novorosiyysk Route |
300,000 |
970+840 |
$2.179B |
|
Route Red + Makhachkala Novorosiyysk Route |
500,000 |
970+840 |
$2.712B |
As seen, even though pipeline length increases, the cost decreases. The model as stated is highly insignificant, but it is the best that can be done with the data available.
Inferring our statistical analysis, we can speculate that the based on capacity and the length of the project we are proposing, the cost will be around $2.712B for a pipeline of capacity 500,000 bpd and length 1810 km.
In 2017, Iran and Russia signed a deal for Iran to export 100,000 bpd to Russia from the Neka port signifying that, such a deal is possible between the two countries. The oil was agreed to be transported using oil tankers (Mehr News Agency, 2017).
The biggest capacity oil tankers that can dock both at Makhachkala and Neka are medium-sized crude tanker class called Panamax (ITE Transport & Logistics, 2018; NMSC Kazmortransflot LLP, 2017). Their capacity is on average 65,000 tons (Maritime Connector, 2018). However, in 2012 Makhachkala port could handle ships up to 12 thousand tons in weight, with plans increasing it to 63 thousand tons (Ziyanov, 2012). Currently, Iran and Russia’s oil tanker fleet in Caspian Sea is significantly smaller than other littoral Caspian states. Russia has at least 21 oil tankers in Caspian Sea (Abbasova, 2016). Iran on the other hand had at least 3 Panamax oil tankers in Caspian Sea that was being constructed in 2006 and even had more fleets that were in the fleet as rental ships (Mehr News Agency, 2006). Moreover, if need arises, ships of capacity up to 5000 tons can be brought to Caspian Sea using Volga-Don, Volga-Baltic Canal (Israfilbayova, 2018). However, 5000 tons for an oil tanker is a quite limiting value.
In Caspian sea, an oil tanker makes 7-8 voyages per month (Egypt Oil & Gas Newspaper, 2015). In order to achieve 500,000 bpd over a year, 25.55 mtoe needs to be shipped in a year. With tankers of capacity 63,000 tons, 55 ships are sufficient to transport the required amount. Unfortunately, neither of the countries have sufficient number of ships, capable of carrying this much oil. The maximum that ships can transport is approximately 250,000 bpd, given the size of Russian and Iranian fleet.
The average freight rate in Caspian sea is around $30/ton (Abbasova, 2016). Thus, transporting 500,000 bpd costs $2,110,000. In a year, it is $765 million. The pipeline project that transports 500,000 bpd was estimated to cost around $2.71 billion. Thus, it would take just less than 4 years of constant usage of oil tankers to have a cost equal to the pipeline project, excluding the opportunity cost of occupying 55 ships for the Iranian and Russian oil fleets.
Although trade deals with ships can be cancelled any time, and the problem of pipeline going through the territory of another country is a non-issue for oil tankers, in terms of feasibility and cost effectiveness, using oil tankers seems to lag behind pipeline solution.
Historical approach to the relationship between Soviet Russia and Iran about Caspian
Before the dissolution of the Union of Soviet Socialist Republic, the Caspian Sea was controlled by just two states which were the USSR and Iran. The Soviet-Iranian Treaty of 1935 and 1940 gave each state “exclusive right of fishing in its coastal waters up to a limit of 10 nautical miles” (Exchange Notes, 1940). Although this original provision had nothing to do with the seabed and the resources (subsoil) under the ground, there was an understanding that the interest of the USSR and Iran were still in the further explorations of the issue of 10 nautical miles. During this reconnaissance period, both the USSR and Iran did not make any formal complaints to other regions. The Soviet-Iranian agreement of 1935 fulfilled its purpose before the dissolution of the Soviet Union in 1991. With the addition of more littoral states, the questions of underground and seabed resources and the exports became a completely new international dispute (Clagett, 1995). It was just two states problem but then it became a struggle among the five littoral states. “The extensive body of law relating to the oceans is not fully and directly applicable to inland seas, even though the UN Convention on the Law of the Sea speaks in its preamble of “the seas and oceans” of the world, and that Part IX of the convention is entitled “Enclosed or Semi-Enclosed Seas,” there is still questions that have no answers. (Clagett, 1995; Ivy, 2002).
When the German navy conquered Soviet Russia on 22 June 1941, Iran reaffirmed its neutrality and then Soviet perceived Iran as a German base. That’s why Soviet and British forces invaded Iran, the Soviet air units and naval in the Caspian bombarded the Iranian coast. After WWII, presence of the Soviet in Iran continued into 1946 and Soviet assisted old Iranian part of Caspian back to Iranian control. Then, in the 1950s, Soviet and Iran did good neighborly agreements about Caspian.
When we look at the social perspective of the relationship between Soviet Union and Iran, Soviet religious ideological framework differs from Iran’s religious ideology which is based on monotheistic religion. The fact that Soviet’s main goal was to create society which relates to atheistic form of belief. Relying to this point we can see inevitable clash of belief sets. Soviet was following the policy of distracting nation from other kinds of fear, and according to this policy religion is directly related with fear and control means. In this time specter, governing policies and foreign policy principles were defining factors for economic relations. In addition, US and Soviet relations, Cold War and US and Iran relations are constraints that would be affecting political international arena’s condition. As a relative conclusion, we can mention that Iran and Soviet relations would not be future promising and economically bright.
Conflict Similar to Dispute in Caspian Sea
This case caused a special agreement by International Court of Justice in 1992. It contains “six sectors of international land frontier, legal situation of islands and of maritime spaces inside and outside the Gulf of Fonseca” (International Court of Justice, 1992). Similar but at the same time different from some aspects dispute took place in Central America. States such as Belize, Guatemala, Honduras and etc., are located too close to each other because of geographical conditions. Because of this fact, these countries cannot decide according to maritime law at least their territorial waters. Starting from first 12 nautical miles, all zones, including exclusive economic zones as well are clashing. These phenomena led to variable disputes in economic field from taxation, commercial angles. Distribution of inequalities of natural resources are issue as well. As a similarity, we could mention that legal status still uncertain and both two cases have colonialism background. The dispute was brought to ICJ at the end.
REFERENCES
Abbasova, G. (2016). Expert: Growing number of tankers in the Caspian Sea strengthens competition. Retrieved from https://report.az/en/energy/expert-growing-number-of-tankers-in-caspian-sea-strengthens-competition/
Abilov, S. (2013). Legal Status of the Caspian. Retrieved from https://www.researchgate.net/profile/Shamkhal_Abilov/publication/320183299_LEGAL_STATUS_OF_THE_CASPIAN/links/59d3defca6fdcc181ad948cc/LEGAL-STATUS-OF-THE-CASPIAN.pdf?origin=publication_detail
A guide to Iran’s oil exporting ports | ITE Transport & Logistics. (2016). Retrieved from http://www.transport-exhibitions.com/Market-Insights/Iran/Archive/A-guide-to-Iran%E2%80%99s-oil-exporting-ports
A library of ExxonMobil crude oil blends sorted by API gravity and by sulfur content. (2018). Retrieved from https://corporate.exxonmobil.com/en/company/worldwide-operations/crude-oils/crude-blends-by-characteristic
Aliyeva, K. (2017). Iran to increase oil swap with Caspian states. Retrieved from https://www.azernews.az/region/119280.html
Aliyeva, K. (2018). Caspian Sea status. What will it bring to Azerbaijan?. Retrieved from https://www.azernews.az/nation/135271.html
Analysis: Oil and gas pipelines in the Middle East. (2015). Retrieved from https://southfront.org/analysis-oil-gas-pipelines-middle-east/
Astrakhan Region. (2018). Retrieved from http://www.lukoil.com/Company/BusinessOperation/GeographicReach/Russia/astrahanregion AzerNews. (2018). Turkmenistan needs Azerbaijan, Turkey to get its gas to Europe. Retrieved from https://www.azernews.az/oil_and_gas/134175.html
Barrel Breakdown. (2016). Retrieved from http://graphics.wsj.com/oil-barrel-breakdown/
Beevor, E. (2018). As Europe and the U.S. Diverge on Iran, the SWIFT Financial Network is Stuck in the Middle. Retrieved from https://www.albawaba.com/news/europe-and-us-diverge-iran-swift-financial-network-stuck-middle-1184096
Blackman, S. (2012). The world's longest oil and gas pipelines. Retrieved from https://www.hydrocarbons-technology.com/features/featureworlds-longest-oil-gas-pipelines-imports/
Blinick, A. (2008). Pipeline Diplomacy, (21), 122-127. Retrieved from https://www.thenewatlantis.com/publications/pipeline-diplomacy
BP. (2018). BP Statistical Review of World Energy 2018. BP. Retrieved from https://www.bp.com/content/dam/bp/en/corporate/pdf/energy-economics/statistical-review/bp-stats-review-2018-full-report.pdf
Cameron. (2012). Crude Oil Blending [Ebook]. Retrieved from http://www.coqa-inc.org/docs/default-source/meeting-presentations/20121107-08_Stewart.pdf
Carroll, O. (2018). Russia is about to sign a deal that will give it a huge military and economic boost. Retrieved from https://www.independent.co.uk/news/world/europe/russia-says-deal-to-settle-status-of-caspian-sea-reached-a8486311.html
CASE CONCERNING LAND, ISLAND AND MARITIME FRONTIER DISPUTE (EL SALVADOIUHONDURAS: NICARAGUA INTERVENING). (1992). Retrieved from https://www.icj-cij.org/files/case-related/75/6673.pdf
Caspian Oil Swap Underway at Neka. (2017). Retrieved from https://financialtribune.com/articles/energy/72741/caspian-oil-swap-underway-at-neka
CASPIAN SEA ii. MODERN DIPLOMATIC HISTORY – Encyclopaedia Iranica. (2018). Retrieved from http://www.iranicaonline.org/articles/caspian-sea-ii-diplomatic-history-in-modern-times
Chen, A. (2018). China's CNPC to take oil from Iranian fields it owns as normal. [online] U.S. Available at: https://www.reuters.com/article/us-china-iran-sanctions-waiver/chinas-cnpc-to-take-oil-from-iranian-fields-it-owns-as-normal-idUSKCN1NE09V [Accessed 14 Nov. 2018].
Clagett, Brice M., “Ownership of Seabed and Subsoil Resources in the Caspian Sea Under the Rules of International Law,” Caspian Crossroads Magazine, Volume 1, issue 3, Fall 1995.
Coleman, N. (2018). Caspian oil and gas: High hopes for a tough neighborhood. Retrieved from http://blogs.platts.com/2018/07/09/caspian-oil-gas-azerbaijan-energy/
Conca, J. (2014). Pick Your Poison For Crude -- Pipeline, Rail, Truck Or Boat. Retrieved from https://www.forbes.com/sites/jamesconca/2014/04/26/pick-your-poison-for-crude-pipeline-rail-truck-or-boat/#181635f617ac
Convention on the Legal Status of the Caspian Sea. (2018).
CPI Inflation Calculator. (2018). Retrieved from https://data.bls.gov/cgi-bin/cpicalc.pl
Crooks, E. (2018). The week in energy: Agreement on the Caspian Sea. Retrieved from https://www.ft.com/content/d9fdb2a0-a24d-11e8-85da-eeb7a9ce36e4
Crude oil | petroleum product. (2018). Retrieved from https://www.britannica.com/science/crude-oil
Dipaola, A. (2018). Why Iran's Lost Oil Sales Could Be Met by These Three Producers. Retrieved from https://www.bloomberg.com/news/articles/2018-10-02/why-iran-s-lost-oil-sales-could-be-met-by-these-three-producers
Druzhba Pipeline. (2018). Retrieved from https://www.iaot.eu/en/oil-transport/druzhba-pipeline
enerjigunlugu.net. (2018). SOCAR, Rusya üzerinden daha az petrol satacak | Enerji Günlüğü | Enerji Haberleri. [online] Available at: https://enerjigunlugu.net/icerik/24521/socar-rusya-uzerinden-daha-az-petrol-satacak.html [Accessed 19 Oct. 2018
Eni Norge. (2018). World Oil Review 2018. Eni Norge. Retrieved from http://www.eninorge.com/Documents/WORLD-OIL-REVIEW-2018-Volume-1.pdf
En.transneft.ru/investors/219/. (2018). Annual Report 2017. [online] Available at: https://www.transneft.ru/u/section_file/32761/20180911_book_eng.pdf [Accessed 18 Oct. 2018].
ETC Oil Properties Database. (2018). Retrieved from http://www.etc-cte.ec.gc.ca/databases/Oilproperties/
ETEnergyworld.com. (2018). Pakistan asks Iran to resume natural gas pipeline negotiations - ET EnergyWorld. [online] Available at: https://energy.economictimes.indiatimes.com/news/oil-and-gas/pakistan-asks-iran-to-resume-natural-gas-pipeline-negotiations/64088020 [Accessed 11 Oct. 2018].
Eurostat. (2018). EU imports of energy products - recent developments. Eurostat. Retrieved from https://ec.europa.eu/eurostat/statistics-explained/pdfscache/46126.pdf
Eurostat. (2018). Data reporting form for crude oil imports. Eurostat. Retrieved from http://ec.europa.eu/transparency/regexpert/index.cfm?do=groupDetail.groupDetailDoc&id=36803&no=2
Fatmala, N. (2016). Offshore Pipeline Installation. Retrieved from http://nfatmala.blogspot.com/2016/02/offshore-pipeline-installation_5.html
Financial Tribune. (2018). US Sanctions to Help Russia Overtake Europe in Iran Trade. [online] Available at: https://financialtribune.com/articles/economy-domestic-economy/87589/us-sanctions-to-help-russia-overtake-europe-in-iran-trade [Accessed 12 Oct. 2018].
Foy, H. (2018). Putin pledges deeper ties with Iran and other Caspian Sea states. Retrieved from https://www.ft.com/content/93c52100-9e16-11e8-85da-eeb7a9ce36e4
Gamal, R. (2017). Iraq wants to reopen old Saudi crude exports pipeline - former... Retrieved from https://www.reuters.com/article/uk-iraq-saudi-oil/iraq-wants-to-reopen-old-saudi-crude-exports-pipeline-former-minister-idUKKBN1AQ0IB
Gas Trunk Lines. (2018). Retrieved from http://www.pogc.ir/OilGasLogesticProjects/GasTrunkLines/tabid/162/Default.aspx
Green, K. and Jackson, T. (2017). Intermodal Safety for Oil and Gas Transportation. Safety First. [online] Fraser Institute. Available at: https://www.fraserinstitute.org/sites/default/files/safety-first-intermodal-safety-for-oil-and-gas-transportation.pdf [Accessed 23 Oct. 2018].
Harris, G., & Ewing, J. (2018). U.S. to Restore Sanctions on Iran, Deepening Divide With Europe. Retrieved from https://www.nytimes.com/2018/08/06/us/politics/iran-sanctions-trump.html
Harvard WorldMap. (2018). Retrieved from http://worldmap.harvard.edu/data/geonode:global_oil_pipelines_7z9
Hill, F. (2004). Pipelines in the Caspian - Catalyst or Cure-All [comments]. Georgetown Journal of International Affairs, 17. Retrieved from http://search.ebscohost.com/login.aspx?direct=true&db=edshol&AN=edshol.hein.journals.geojaf5.8&site=eds-live
Historical Currency Converter. (2018). Retrieved from http://www.historicalstatistics.org/Currencyconverter.html
Husseini, T. (2018). The world's longest pipelines in the oil and gas industry. Retrieved from https://www.offshore-technology.com/features/worlds-longest-pipelines/
Indeo, F. (2018). Settling the Caspian Issue and Realizing the Trans-Caspian Energy Corridor. Retrieved from https://thediplomat.com/2018/07/settling-the-caspian-issue-and-realizing-the-trans-caspian-energy-corridor
International trade in goods - Exports 2001-2017. (2018). Retrieved from http://www.intracen.org/itc/market-info-tools/statistics-export-country-product/
Iran's Light Crude Hits Highest Since Mid-2015. (2018). Retrieved from https://financialtribune.com/articles/energy/79828/irans-light-crude-hits-highest-since-mid-2015
Iran ready to host Russian oil tankers. (2017). Retrieved from https://en.mehrnews.com/news/122407/Iran-ready-to-host-Russian-oil-tankers
Iran ready to host Russian oil tankers: Official. (2017). Retrieved from https://theiranproject.com/blog/2017/01/01/iran-ready-to-host-russian-oil-tankers-official/
Israfilbayova, S. (2018). SOCAR increases oil export via Baku-Novorossiysk pipeline by 15pct. Retrieved from https://www.azernews.az/oil_and_gas/126358.html
Israfilbayova, S. (2018). Volume of oil tanker transportation in Caspian Sea to increase. Retrieved from https://www.azernews.az/business/131345.html
Ivy, A. (2002). International Law of the Caspian Sea. Retrieved from https://web.stanford.edu/class/e297a/International%20Law%20and%20Concerns%20of%20the%20Caspian%20Sea%20Region.htm
Federal Reserve Bank of St. Louis. (2018). Countries | FRED | St. Louis Fed. Retrieved from https://fred.stlouisfed.org/categories/32264
Karbuz, S. (2016). The legal status of the Caspian Sea: Implications on Caspian resources development and transport. Energy Policy Turkey, (2nd Issue), 62-69. Retrieved from http://dergipark.gov.tr/download/issue-file/6571
Karbuz, S. (2018). Ağrı kesici gibi Hazar Anlaşması - PetroTurk. Retrieved from http://petroturk.com/makale/agri-kesici-gibi-hazar-anlasmasi
Kostianoy, A., & Kosarev, A. (2005). The Caspian Sea Environment. Berlin, Heidelberg: Springer-Verlag Berlin Heidelberg.
Kramer, A. (2018). Russia and 4 Other Nations Settle Decades-long Dispute Over Caspian Sea. Retrieved from https://www.nytimes.com/2018/08/12/world/europe/caspian-sea-russia-iran.html
Kurtmulayev, A. (2012). The Caspian Sea: Ports, Tankers and Shipments. Retrieved from https://acturca.info/2012/03/27/caspian-sea/
LAND, ISLAND AND MARITIME FRONTIER DISPUTE (EL SALVADOR/HONDURAS: NICARAGUA intervening). (1992). Retrieved from https://www.icj-cij.org/files/case-related/75/075-19920911-JUD-01-00-EN.pdf
Lee, J. and Longley, A. (2018). Iran's Tracked Oil Exports Hit 2 1/2 Year Low Before Sanctions. [online] Bloomberg.com. Available at: https://www.bloomberg.com/news/articles/2018-10-01/iran-s-tracked-oil-exports-hit-2-1-2-year-low-before-sanctions [Accessed 10 Oct. 2018].
Lee, J. (2018). Iran Endures Longest Gap in China Oil Buying in at Least 3 Years. [online] Bloomberg.com. Available at: https://www.bloomberg.com/news/articles/2018-09-13/iran-endures-longest-gap-in-china-oil-buying-in-at-least-3-years [Accessed 11 Oct. 2018].
Louppova, J. (2017). Russia plans to develop Caspian ports. Retrieved from https://port.today/russia-plans-develop-caspian-ports/
Lukoil. (2018). LUKOIL AND ASTRAKHAN REGION DEVELOP COOPERATION. Retrieved from http://www.lukoil.com/api/presscenter/exportpressrelease?id=198035
Metelitsa, A., & Albanese, N. (2014). Russia looks beyond West Siberia for future oil and natural gas growth. Retrieved from https://www.eia.gov/todayinenergy/detail.php?id=18051
Monga, V. (2018). Keystone XL Pipeline Obtains Enough Shipper Commitments to Proceed. Retrieved from https://www.wsj.com/articles/keystone-xl-pipeline-obtains-enough-shipper-commitments-to-proceed-1516298281
NITC to take on 370,000 bpd swap at Caspian Sea. (2006). Retrieved from https://en.mehrnews.com/news/15502/NITC-to-take-on-370-000-bpd-swap-at-Caspian-Sea
NMSC Kazmortransflot LLP. (2017). NMSC Kazmortransflot LLP Hong Kong Investor Day presentation [Pdf]. Hong Kong. Retrieved from http://www.jp-kz.org/conference/roadshow/17KazMorTransFlot.pdf
OPEC. (2018). OPEC International Oil Data. Retrieved from https://asb.opec.org/index.php/data-download
Paraskova, T. (2018). European Refiners Could Ditch Poor Quality Russian Crude | OilPrice.com. Retrieved from https://oilprice.com/Energy/Crude-Oil/European-Refiners-Could-Ditch-Poor-Quality-Russian-Crude.html
Parkhomchik, L., Simsek, H., & Nurbayev, D. (2016). NATURAL GAS PIPELINE INFRASTRUCTURE IN CENTRAL ASIA. Almaty: Akhmet Yassawi University. Retrieved from http://www.ayu.edu.tr/static/aae_haftalik/aae_bulten_en_67.pdf
Petroleum - Classification. (2018). Retrieved from http://www.petroleum.co.uk/api
Petroleum Composition | What is the composition of petroleum. (2018). Retrieved from http://www.petroleum.co.uk/composition
Petrotech. (2018). Russia Export Blend Crude Oil. Retrieved from http://www.pakpasinvestmentholdings.com/23.EMBAREFINERY/0.LIBRARY-II/3.CrudeOil-REBCO.pdf
Petrov, E., & Amelin, N. (2015). Gaining a Regional Perspective. GEO Expro, 10(5). Retrieved from https://www.geoexpro.com/articles/2015/04/gaining-a-regional-perspective
Pipeline, Ship, or Rail: Different Transport Methods for Oil and Gas. (2016). Retrieved from http://setxind.com/midstream/pipeline-ship-rail-benefits-needs-different-oil-gas-transport-methods/
Pipeline Towing Method for Pipeline Installation. (2018). Retrieved from http://www.drillingformulas.com/pipeline-towing-method-for-pipeline-installation/
Pirani, S. (2018). Let’s not exaggerate: Southern Gas Corridor prospects to 2030. Oxford Institute Of Energy Studies. doi: 10.26889/9781784671167
Ratio Blending Calculator | Schlumberger. (2018). Retrieved from https://www.products.slb.com/measurement/types/sampling/ratio-blending
Ricker, C., Barron, J., & Hamilton, M. (2017). Changing quality mix is affecting crude oil price differentials and refining decisions. Retrieved from https://www.eia.gov/todayinenergy/detail.php?id=33012
Schwarz, J. (2018). One Map That Explains the Dangerous Saudi-Iranian Conflict. Retrieved from https://theintercept.com/2016/01/06/one-map-that-explains-the-dangerous-saudi-iranian-conflict/
Shaban, I. (2018). Makhachkala Port reduced oil transshipment by 2.8 times in 2017 – Caspian Barrel. Retrieved from http://caspianbarrel.org/en/2018/02/makhachkala-port-reduced-oil-transshipment-by-2-8-times-in-2017/
Socar.az. (2018). Transportation · SOCAR. [online] Available at: http://www.socar.az/socar/en/activities/transportation/baku-novorossiysk-oil-pipeline [Accessed 18 Oct. 2018].
Socor, V. (2007). IRAN-ARMENIA GAS PIPELINE: FAR MORE THAN MEETS THE EYE. Retrieved from https://jamestown.org/program/iran-armenia-gas-pipeline-far-more-than-meets-the-eye/
Soldatkin, V. (2018). Russia's oil exports to Europe decline as quality worsens. Retrieved from https://www.reuters.com/article/us-russia-oil-urals/russias-oil-exports-to-europe-decline-as-quality-worsens-idUSKBN1I923D
Stratfor. (2016). In World Energy Atlas (7th ed.).
Sunshine, W. (2018). The 4 Ways Crude Oil Is Classified. Retrieved from https://www.thebalance.com/the-basics-of-crude-oil-classification-1182570
Tankers Become Top Option for Moving Caspian Sea Oil. (2015). Retrieved from https://egyptoil-gas.com/news/tankers-become-top-option-for-moving-caspian-sea-oil/
The Formation and Physiography of the Caspian Sea. (2018). Retrieved from http://www.azerbaijan.az/_Geography/_Caspian/_caspian_e.html?caspian_02
The Observatory of Economic Complexity. (2018). Retrieved from https://atlas.media.mit.edu
The oil and gas pipeline system of Norway. (2016). Retrieved from https://www.norskpetroleum.no/en/production-and-exports/the-oil-and-gas-pipeline-system/#oil-pipelines
The Solution to the Growing Hostilities in Ukraine. (2015). Retrieved from http://viableopposition.blogspot.com/2015/03/the-solution-to-growing-hostilities-in.html
Theodora.com. (2017). Middle East Pipelines map - Crude Oil (petroleum) pipelines - Natural Gas pipelines - Products pipelines. [online] Available at: https://theodora.com/pipelines/middle_east_oil_gas_products_pipelines_map.html
TOTSA - Crude Oil - Assays. (2018). Retrieved from https://www.totsa.com/pub/crude/index2.php?expand=5&iback=5&rub=11&image=middle_east
Tradingeconomics.com. (2018). Iran Crude Oil Production | 1973-2018 | Data | Chart | Calendar | Forecast. [online] Available at: https://tradingeconomics.com/iran/crude-oil-production [Accessed 11 Oct. 2018].
Treaty of Commerce and Navigation with Exchange Notes 1940
Trend.Az. (2018). SOCAR Becomes Operator of Azerbaijani Section of Baku-Novorossiysk Pipeline. [online] Available at: https://en.trend.az/business/energy/1128666.html [Accessed 19 Oct. 2018].
U.S. Energy Information Administration. (2013). Oil and natural gas production is growing in Caspian Sea region. Retrieved from https://www.eia.gov/todayinenergy/detail.php?id=12911
U.S. Energy Information Administration. (2018). Country Analysis Brief: Azerbaijan. EIA.
U.S. Energy Information Administration. (2015). Country Analysis Brief: Iran. EIA.
U.S. Energy Information Administration. (2018). Country Analysis Brief: Iran. EIA.
U.S. Energy Information Administration. (2018). Country Analysis Brief: Kazakhstan. EIA.
U.S. Energy Information Administration (2017). Country Analysis Brief:Russıa. EIA.
U.S. Energy Information Administration. (2018). Country Analysis Brief: Russia. EIA.
U.S. Energy Information Administration. (2018). Country Analysis Brief: Turkmenistan. EIA.
Verma, R. (2018). ESPO pipeline capacity expansion - a mixed bag for tankers. Retrieved from https://www.drewry.co.uk/maritime-research-opinion-browser/maritime-research-opinions/espo-pipeline-capacity-expansion---a-mixed-bag-for-tankers
WITS. (2018). Trade Statistics by Country. Retrieved from https://wits.worldbank.org/countrystats.aspx
What Is EOR, and How Does It Work?. (2018). Retrieved from https://www.rigzone.com/training/insight.asp?insight_id=313
Zimnitskaya, H., & von Geldern, J. (2010). Is the Caspian Sea a sea; and why does it matter?. Journal Of Eurasian Studies, 2(1), 1-14. doi: 10.1016/j.euras.2010.10.009
Ziyadov, T. (2012). Azerbaijan as a regional hub in Central Eurasia. Baku: Azerbaijan Diplomatic Academy.
Zohn, I., Kosarev, A., Glantz, M., & Kostianoy, A. (2010). Makhachkala. In The Caspian Sea Encyclopedia (1st ed., p. 281). Berlin: Springer.